“History never repeats itself, but it often rhymes.” -Mark Twain
We wrote recently about the huge valuation spread between the 100 most expensive stocks in the S&P 500 Index and the 100 cheapest stocks. All the academic studies we’ve seen show that cheap stocks outperform average and expensive securities despite the bright futures which the more expensive ones are assumed to have. Thanks to some great writing by Corrie Driebusch and Chris Whittall of the Wall Street Journal (WSJ), we have more evidence and an effective way to cross-check that analysis in a piece called “Popular Investments Are Ripe for a Fall.” Their well-written article is very germane to the current discussion and this is how they introduced the subject:
Investors are worried that some of this year’s most popular trades are vulnerable to a reversal.
Government bonds, dividend-paying stocks and emerging-market securities have been bid up in the global search for yield. In an unusually quiet market, any shift in sentiment could send investors who have piled into similar positions all heading to the exits at the same time. [i]
Our research showed that the cheapest stocks trade for 10.2 times after-tax-profits on Wall Street consensus estimates for 2017 versus over 50 times the profits of the 100 most expensive stocks in the index. It is also the biggest spread we could find since the tech bubble of the late 1990’s. In other words, the present reality rhymes with late 1999. We concluded from looking at the breakdown of the 100 cheapest stocks that financials dominated the lineup, with 33 entries, followed by numerous economically-sensitive industries like airlines (industrials), housing and retailers (consumer discretionary). This is very similar to the composition of the 100 cheapest P/E stocks at the beginning of 2000.
With kudos to the WSJ writers and the researchers at Alliance Bernstein, here is another picture of the same subject with more proof of our thesis going back to 1998.
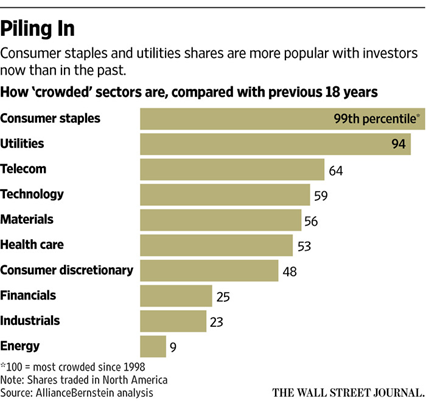
From a historical perspective, what do you do with a chart like this as a long-duration stock picking organization? Initially, you start out by digging into these numbers to look for anomalies in the sectors which help to frame the crowded and lonely trades.
The consumer discretionary category is heavily skewed in the Alliance Bernstein chart by the inclusion of Amazon (AMZN) and Netflix (NFLX). Amazon trades at a capitalization equal to 1.58% and Netflix trades at .22% of the entire S&P 500 Index. They make up a whopping 15% of the consumer discretionary sector. At trailing P/E ratios of 192 and 325, respectively, they are distorting how out of favor the consumer discretionary category currently stands. The consumer discretionary sector trades at 19.7 times trailing earnings and imagine what it would be without Amazon and Netflix. We’ve shown recently that many consumer discretionary companies trade among the cheapest 100 stocks in the S&P 500 Index.
Since these companies (AMZN, NFLX) are traded and organized as technology companies, this is making consumer discretionary look very normally owned (48th percentile) and tech comes away not nearly the historical darling that we believe it is today (58th percentile). Since Amazon is getting almost all its profit from their AWS cloud business, it is easy for us to add their capitalization to the tech sector of the index. If you do this, it makes the current circumstance even more like 1999.
A quick reminder of what happened back in the late 1990’s. The technology and telecom sector investments went to the highest P/E multiples in history. The money poured into U.S. large-cap growth mutual funds and they in turn bought more of the tech/telecom bubble stocks and invested heavily in growth-oriented large-cap consumer staple shares. In other words, they “piled in” to trades which were the most crowded in the history of the U.S. stock market. Growth strategies completely swamped value disciplines.
When you compare the last 18 years as Bernstein did, the average includes 1998-2000, dramatically understating how crowded owning tech is today. It means there were three years out of 18 in which tech was the most expensive any S&P 500 sector has been in 70 years. These facts make the 59 percentile ranking ex-Amazon look heavily understated. Compared to the last 15 years, tech is at the very high end of popularity. With Amazon and Netflix included, it would put tech well above the 90th percentile, based on our analysis. This time growth buyers were joined by income-chasing dividend stock investors who have “piled in” on generous dividends coming from staple, utility, telecom and tech companies. We advise the buyers of historically expensive common stocks to beware! Today, these sectors are being piled into by passive index investors (automatically by capitalization) and Exchange-Traded-Funds (ETFs), which are emphasizing the currently hot and over-crowded dot. Can you hear the rhyme?
For other reasons, we must be extremely careful with energy investments. In the majority of the last 18 years, energy companies had one of their best runs in history. Therefore, its percentile ranking is a bit deceptive because they were one of the darlings during the China Boom of 2004 to 2014. This isn’t very difficult for us to deal with due to their weakened balance sheets and negative free cash flow numbers. None of the integrated oil companies or the exploration and production companies even vaguely fit our qualitative criteria for stock selection.
Lastly, among the anomalies, the last 18 years included deeply out-of-favor periods for financials from 1998-2000, 2007-2012 and the last year. As you know, we believe they have effectively become a political and investing cuss word. This means financials are in the 25th percentile as compared to a really terrible 18 years of existence!
Besides examining the anomalies, we need to examine our existing holdings to see if we own anything manically priced in the more popular sectors which investors have “piled” into. We own Johnson and Johnson (JNJ) and Walgreen’s (WBA), which have historically traded with the consumer staple sector of the index. Both trade at a sizable discount to the consumer staples category on a price-to-earnings (P/E) ratio basis and trade more in sympathy with the healthcare sector (where JNJ resides) and with the consumer discretionary sector in the case of WBA. We will watch them vigilantly.
We must double our efforts to find and hold companies which fit our eight criteria for common stock ownership and are in great disfavor from a long-duration standpoint. Among financials, American Express (AXP) has some problems in the aftermath of divorcing Costco (COST), but it has one of the premier balance sheets, credit card businesses and free cash flow in the S&P 500 Index. It trades at a big discount to the index, its peers and to where it has traded in much higher interest rate environments over the last 18 years.
The article and chart continues to make us drool over the shares of Berkshire Hathaway (BRKB). Buffett has it loaded with financials like Bank of America (BAC), Wells Fargo (WFC), Amex and GEICO. Buffett also owns industrial companies like Burlington Northern Santa Fe, Precision Castparts and Marmon Group. It looks like a marvelous way to bargain hunt in the most out-of-favor sectors. Berkshire is under-owned and very contrary at 1.3 times book value.
In conclusion, this chart and our analysis makes us feel very good about the future performance of our portfolio relative to the S&P 500 Index or other passive large-cap vehicles. A massive part of the total capitalization of the S&P sits in the spendy consumer staples and glamour technology stocks, making it rhyme with 1999. Other active managers are very committed to them as compared to the last 18 years. On the other hand, we are heavily over-weighted financials (30%) and consumer discretionary shares (32.5%), which are under-owned by active managers when AMZN and NFLX are excluded. We believe as the rhyme plays out, there is very little chance of investors piling out of under-owned holdings which meet our eight criteria for stock selection.
William Smead is CEO and chief investment officer at Smead Capital Management.