It was a balmy December evening in Fort Lauderdale. Two financial planners and old buddies, one from a large wirehouse and the other an independent practitioner, were reminiscing over a happy hour beer about how kind the year 2007 had been to their practices. Their practices were flourishing, their firms had done well and the performance bonuses were lighting their Christmas tree with holiday gifts. Inevitably, the subject of retirement planning kept cropping up, as many of the existing clients were in positions to retire and be comfortably well off for the rest of their retirement lives.
Inevitably, too, the discussion swerved back on the asset allocation methods that each advisor had used to plan retirement income distribution models. It was inevitable because this discussion had happened many times before and the buddies liked to quarrel over their methods of allocation-one advisor was all about Modern Portfolio Theory (MPT) and Efficient Market Hypothesis (EMH) and considered anything outside the Markowitz Efficient Frontier to be archaic-especially her buddy's model, which included the use of a ridiculously simple rule of thumb (ROT) where the retiree's age decided the allocation between 30-year Treasury bonds (or TIPS, international gilts or some high, guaranteed fixed annuity product) while the rest was invested in global large-cap stocks. In this model, if the client were 65 at retirement, then 65% would be in bonds and 35% in stocks.
The MPT asset allocator buddy loved to tease her friend about her naïve model and crow about the robustness of the MPT. For most of the well-off clients, the 30-year diversified income distribution model for 65-year-old retirees was suggesting about a 60% dedication to risky securities (stocks, emerging markets, commodities, currencies, real estate, etc.) and a 40% fixed-income securities (including T-bonds, high yielding debt, etc.) asset allocation along with an actively managed portfolio.
The discussion turned to clients who were retirement-ready and about 65 years of age. Such clients had done well over the past four to five years and had accumulated all the means to live the next 30 years in a conveniently luxurious life. They couldn't care less if their expected Social Security payments stopped materializing fully after 2019. They had enough in their retirement and personal portfolios to live their dream lives-to do what they wanted to do and be with whom they chose to be with wherever they wished to be-i.e., their ideal retirement. So they wished to retire.
Both the financial advisor buddies had counseled their clients that a withdrawal rate of 4% per year of their retirement funds (given the expected portfolio earnings rates) was such a safe rate that it would ensure they would not outlast their funds. Then, the summer of 2008 happened!
The clients had never imagined that they could be out on a limb, or even if they did, that the limb could ever be chopped. Now, half their wealth and all their dreams are shattered. And ... they could not get their livelihood back.
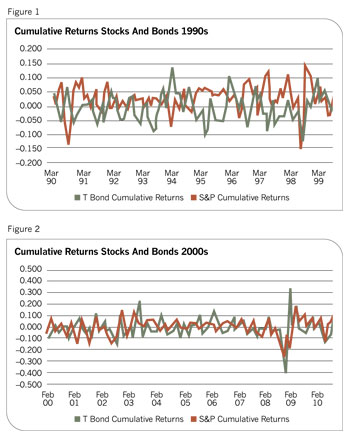
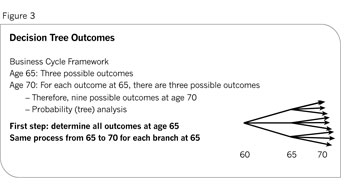
There are nightmares that sometimes come true, but few could probably be worse. In this event, they were the victims of the worst-case scenario of a type of retirement risk, a risk that has been coined as "sequence risk." Unfortunately, looking back at the very recent past, we know that the MPT buddy and her clients were in much hotter water than the ROT buddy and her clients in terms of sequence risk. The following figures show cumulative asset class performance in the last two decades-cumulative in the sense of what a dollar would have grown to in ten years. (See Figures 1 and 2.)
In most cases, the effects of sequence risk are neither this immediate nor this dreadful. Before we do go into describing the more common occurrences of this risk type, it is useful to describe sequence risk in a little greater detail. First, let's look at the actual and very real world effects of sequence risk as found by contemporary studies.
An Employee Benefit Research Institute (EBRI) report finds that the vast majority of 401(k) plan participants have regained the ground lost since 2008, (thanks primarily to ongoing account contributions); it is well-known that people who were about to retire or had already retired had not been able to recoup their losses. Another recent EBRI survey reports that a quarter of workers have postponed their retirement in the past year, or worse, are being forced back to work if they're lucky enough to find and healthy enough to work in their old age.
More telling are the results of studies done through the Americans for Secure Retirement organization by Ernst and Young LLP, the venerable accounting firm. To quote, the Ernst & Young February 2009 study (http://www.ey.com/US/en/Newsroom/News-releases/Media-Release-14-07-08DC) found that "almost three out of five new middle-class retirees will outlive their financial assets if they attempt to maintain their pre-retirement standard of living. The study also finds that middle-income Americans entering retirement today will have to reduce their standard of living by an average of 24% to minimize the likelihood of outliving their financial assets.
Those Americans seven years out from retirement are even less prepared, and the study estimates that they will have to reduce their standard of living by even more, an average of 37%. These reductions will be necessary even when assuming that retirees can maintain the same standard of living with income equal to 59% to 71% of their pre-retirement wages." Further, the study found that "retirees are much better prepared to have a financially secure retirement if they have a guaranteed source of retirement income beyond Social Security, such as a fixed annuity or defined benefit plan."
Such a (non-Social Security) source for, say, a married couple making $75,000 at retirement means they will have only a 31% chance of outliving their financial assets if they retain their pre-retirement standard of living. Those dependent on Social Security as their only guaranteed income have a 90% chance of outliving their money.
Other quoted key findings as reported by the study include the following:
Persons that are five to ten years away from retirement have a higher risk of outliving their financial assets than those currently at retirement age. To avoid outliving their retirement assets, these workers age 55 to 59 will have to increase their savings substantially or work beyond age 65. Otherwise, they will have to reduce their standard of living significantly more than today's retirees to minimize the risk of exhausting their financial assets.
Married couples are more likely to outlive their financial assets, due to their longer joint life spans, than singles.
Montana, Wyoming and South Dakota citizens have the highest likelihood of outliving retirement savings.
D.C., Rhode Island, Utah and New York citizens have the least likelihood of outliving retirement savings.
In a purely definitional sense, sequence risk is the risk of retiring at or just before the peak of a business cycle. Ponder for a moment the implications of the definition. Business cycles reflect periods in which the GDP, and subsequently the economy, expands and contracts.
Typically, a complete business cycle is historically observed to be about eight to ten years. In the more distant past, these cycles of growth and recession were more systemic, but since the '70s, with the demise of Bretton Woods and the beginning of the era of free markets and managed economies, growth periods have become flatter and longer while contraction periods have become sharper and shorter. Typical examples of such average patterns are the recessions of 1990-1993 or 2000-2003 and the growth periods of 1993-1999 and 2003-2008 (I've extended both recessions' duration because the initial recoveries were so anemic).
Thus, a better example of sequence risk would be to consider those who retired around 1989 or 1999. For such people, sequence risk was real and very undesirable. Why so? To understand this problem in its proper perspective, it is necessary to merge the retirement income distribution rate with the economic contraction rate of a recessionary period and compare the effects of this merged rate on post-retirement fund values.
Reformulating Retirement Income Distribution
The historical rate on large-cap stocks (S&P 500) is about 11.5% per year. Since 1926, in only four years has the annual return on S&P stocks been between 11% and 13%. The 20% volatility of such stocks provides a good rationale for this observation. Given the average lengths of business cycles, it is also of interest to note that in recessionary periods, there is a significant probability that a portfolio may lose about 3% per year, every year, over a three-to-five year period.
Now, merge these loss rates with retirement income distribution rates, and to this add the mistiming (sequence risk) of retirement. If our hypothetical retiree were to continue to both withdraw 4% per year and lose 3% per year, then at the end of five years, the compounding effect would cause the fund to lose about 35% of its original value. When the retiree is 70, the possibility that he would live another 25 years on the residual would become very unpalatable.
Typically, well-off (HNW) clients will also live longer due to healthier lifestyles; longevity of retirement life would make matters worse. Of course, what goes without saying, financial planners who didn't know better would most likely have lost one or many such clients under such advisory conditions. (From our buddy system story, it would emerge that the naïve ROT style would come out way superior to most MPT-based allocation systems other than contrived ones.)
Given the recent interest in retirement income distribution issues, academics and financial professionals have developed a plethora of models for this problem. They range from simple rules of thumb (4% per year) to sophisticated mathematical models (e.g., Monte Carlo simulation) to exotic sounding models such as layer cake distribution models. What has been conspicuous has been the absence of distribution models that are completely integrated with business cycles. The rest of this article outlines two schemes that incorporate the business cycle and retirement outlay effects within a fairly sophisticated but easy-to-understand framework for a retirement income distribution model.
The Decision Tree Model
A reasonable way to consider sequence risk is to represent its effect as unexpected changes in retirement fund values. For the sake of simplicity and using a hypothetical 65-year-old retiree client who begins planning retirement at age 60, we will assume that the funds are invested only between stocks and bonds. There is no loss of information from this exclusion, and the proposed model can be extended to a portfolio containing multiple asset classes in a fairly straightforward manner. However, it is much easier to follow the logic of the proposed model using only two asset classes and, hence, the simplifying assumption.
Let the year of retirement be year zero. In year one, the portfolio value may go up, down or remain generally unchanged. Year two also contains the same possibilities. Additionally, assume that what happens in year one may also have a bearing on what happens in year two, depending on where we are in the business cycle. Thus, year two is likely to witness an increase in portfolio values if year one was the first year of a growth cycle.
In all such examples, it is also important to remember that the opposites in all such examples are equally likely, i.e., if year one was the first recessionary year, then year two would also most likely witness reductions in portfolio value from the continuing market downturn. A third assumption is that the retirement portfolio has some expected rate of return, depending upon the stock-bond mix.
If year one is a good year for equities, the portfolio value should generally outperform the expected outcome. If year two is also a good year, then the portfolio will have accumulated excess returns over a period of two years. Of course, the reverse for contractionary cycles is equiprobable. The above examples of possible changes in portfolio values can be depicted through what is known as a decision tree. Figure 2 below shows such a tree, except that instead of using annual changes it depicts changes on a five-year business cycle periodicity. (See Figure 3.)
Dynamic Portfolio Management
Let us begin by using a numerical example. Let's say that the expected return on the portfolio is 7% per year and the portfolio has produced an average of 8.5% per year over this time period. In this case, a total excess return of 4.5% simple interest has been earned. In such cases, money managers and advanced planners will harvest and extract this excess return and move it forward to the future.
They will do so by either 1) using a rationalized form of tactical asset allocation to restructure from stocks to bonds; also note that tactical asset allocation is meaningful when it is tied more to business up and down cycles. Important also is to remember that in contractionary cycles, portfolios would then be automatically bond heavy and safer; or, 2) using derivative strategies such as collars and spreads. These excess returns now can be realized once the economy starts contracting. In money management parlance, such tactics are known as income smoothing strategies.
Continuing on this exemplary path, if five such good and well-managed years are followed by five more such years, then at the end of ten years, the whole retirement income plan can be locked up and planners can move over into beneficiary estate planning. Now consider the other extreme at the bottom of the tree of five bad years. After about three such bad years, the natural instinct of the client will be to suggest (often so forcefully that the planner will succumb rather than stick to her/his guns) to sell off the equity holdings (sell low) and place the money in some low-yielding, CD-like securities. Of course, those who do so set themselves back about five to ten years since they lose the advantage of the benefits of a buy-and-hold strategy.
Astute advisors should necessarily point such possibilities out way before such events (documenting the counsel if needed) happen and thoroughly educate their clients both about the long-term nature of the retirement plan and that business cycles imply turnarounds. Any other counsel or action would neither be client friendly nor fiduciary-like. However, if five bad years are followed by five more, then it is a moot issue. Pretty much all people would sink together and nothing much can be done about such situations.
Fortunately, the two extreme paths are also the least likely paths while the paths in between are much more likely. Fortunately too, the strategies outlined earlier, income smoothing (upside) or buy and hold (downside), will work for all the interim paths. Finally, note that the management of retirement funds becomes much easier if clients have saved enough such that a fairly large portion of the portfolio is invested in bonds. The impact of bonds in portfolios is such that the greater the proportion of bonds to stocks, the greater the likelihood of expected outcomes converging toward actual outcomes.
Needs And Age-Based Bucket Plans
Consistent with a mental accounting format, rather than approaching the retirement income distribution issue from the portfolio-income generation side, it is worthwhile to examine the actual expense outlays also in more detail and in this case, three separate buckets of needs and wants. The most basic questions in terms of saving for retirement are: 1) How much income must you help generate to cover the basic necessities of life and allow your clients to live in good health and with dignity, knowing that they took good financial care of themselves and their spouse until the last days of their lives, and, 2) How many conveniences do they want to add on to that foundation?
If they're living beyond their means and need to cut off some of the fat, what fat do they need to get rid of first, and so on? These are really behavioral issues, a trade-off between current consumption and postponing consumption, keeping in mind that the rewards of postponing current consumption are extremely difficult for most midcareer and younger people to conceptualize. The last layer on top of that is how many luxuries they would like to enjoy in retirement.
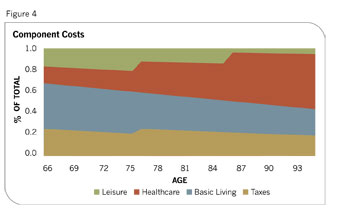
On the age bucket side, the first step for pre-retirees and their advisors should be to calculate the amount that should be set aside for future necessities for the decades in retirement. This entails estimating the level of income needed to meet three of the four general categories of expenses-basic living costs, taxes and health care-which will all vary during the various decades of retirement. The fourth category is of leisure spending that would include expenses for conveniences as well.
For example, most retirees tend to be very active in the first ten years of retirement, so their leisure costs are highest then. As we know, many people delay leisure until this stage of life. Then in the next ten years they start slowing down, spending more time with family.
As leisure expenses slow down, health-care expenses start picking up. In the final ten years, health-care expenses are likely to be at their highest. Figure 3 shows a sample breakdown of expenses for our hypothetical client. For the last two age buckets, final years, it's important to consider other impacts on cost, such as long-term care insurance plans, home ownership and longevity of life issues. When the advisors and their clients model what the clients want to do in retirement, they will have a more holistic picture of their income-distribution needs. (See Figure 4.)
In Conclusion
When retirement funds are dynamically managed as outlined above, retirement income distribution becomes the lesser task. Living a financially planned retirement becomes a pleasure. After all, retirement is the ability to work on something you want to do (which may or may not produce income) and doing so with people who you want to be with. In general, it is so unlike working, which you do because you have to and with people you may not want to be around. This is why retirement is your very own dream enterprise in your golden years.
Somnath Basu is a professor of finance at California Lutheran University and the director of its California Institute of Finance. Dr. Basu also serves as a professor of the Helsinki School of Economics executive MBA program. He's involved with financial planning organizations including the National Endowment for Financial Education, the CFP Board of Standards, International CFP Board and the Financial Planning Association.