


Municipal bonds dominate the fixed-income portfolios of most high-net-worth investors. Municipal bond interest is generally tax-exempt, and this feature results in better after-tax returns than taxable bonds typically offer high tax-bracket investors. Tax rules lend municipal bonds an appeal for private investors that other bond market sectors lack.
Municipal bond markets tend to be less liquid and perhaps more opaque than equity and taxable bond markets. As a result, the conventional wisdom among investors is that municipal bond markets are less efficient (i.e., not as highly competitive) and that mispricing is more common. If true, these conditions present the opportunity for skilled municipal bond managers to earn risk-adjusted, excess return – or alpha.
There is relatively little published research on manager performance and the competitiveness of municipal bond markets. We seek to close this gap by answering some critical questions. What are the common risk factors that explain compensated return and risk for municipal bond portfolios? What is the prevalence of alpha in this unique sector of the bond market? And, most important for private investors, what are the implications for portfolio construction?
Eugene Fama and Kenneth French (1993) show that the sensitivity (beta) of taxable bond portfolios to two common risk factors explains their compensated return and risk.1 The term factor represents the returns from bearing interest-rate (duration) risk. The default (credit) factor represents the returns from bearing equity-like credit risk, which is common in lower-quality bonds.
Borrowing from Fama and French’s empirical work and economic insight, we create versions of these two common risk factors, modified for the municipal bond sector. The modifications mute the noise from idiosyncratic municipal sector risk. Our municipal term factor is defined as the return of the broad market Barclays Municipal Index minus the return of 30-day Treasury bills. Our municipal credit factor is defined as the return of the Barclays High Yield Municipal Index minus the return of the Barclays Municipal Index. Although the Barclays Municipal Index is AA-rated on average (versus AAA for the original Fama-French term factor), the municipal term factor still captures nearly pure municipal term risk when paired with the municipal credit factor. The varying degrees of exposure (betas) to these two risk factors explain compensated municipal bond return and risk across different municipal bond portfolios, with any residual excess positive or negative return credited to alpha.
RESEARCH METHOD AND FINDINGS
Our universe begins with all actively managed municipal bond funds that are nationally diversified in Morningstar’s mutual fund database. We include all funds that have at least 24 months of returns at any point in time since the inception of our factor model (November 1995 to March 2016). The sample includes all funds that were closed or merged with another fund over this time period so that our data are free of survivorship bias. For funds with multiple share classes, the lowest expense share class is used, since high-net- worth investors tend not to pay the higher expenses of retail share classes.
The final sample includes 354 municipal bond mutual funds.
We regress each fund’s full return history (subject to the inception of the factor model) against our municipal term and credit risk factors. Exhibit 1 summarizes the results. The model explains 86% of average return variation, and the average alpha is not positive. This indicates that municipal term and credit factors predominately explain return variation (risk) and entirely explain compensated return and risk, on average.
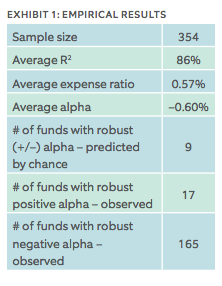 The average alpha is –0.60%, which is nearly identical to the average expense ratio of 0.57%. This suggests that on average, active municipal bond funds are compensated for the factor risk they bear, less expenses. This finding is consistent with our previous results for U.S. equity mutual funds (see our April 2015 investment commentary, “Detecting True Alpha in Highly Competitive Markets”).
It is also interesting to note that 132 funds within the sample of 354 funds were either closed or merged with another fund over the time period. Only four of these “dead” funds returned positive alphas, and the average alpha of the 132 closed or merged funds was –0.97%. That is a statistically significant result, confirming that funds close or merge due to poor performance.
Survivorship bias must be carefully considered when evaluating the performance of surviving funds.
Investors are often interested in top-performing funds, so what about those funds’ alphas? To answer this question, we need to separate luck from skill. In assessing luck, we recognize and expect that some funds will be top performers merely by chance. The t-statistic (t-stat) tells us whether the observed alpha is likely true instead of just a random result. A t-stat greater than 2.0 is considered statistically significant (robust), as it indicates to a 95% confidence level that the observed alpha likely stems from skill.
Given our sample size of 354 funds, nine funds should have produced a robust positive alpha (95% confidence level) just by chance, and an observation of more than nine funds is evidence of skilled fund managers.
We found 17 funds – evidence of skill among a very small sub-set of active municipal bond fund managers. This is a higher prevalence of alpha than studies commonly find for equity mutual funds. However, we also found 165 funds producing robust negative alphas (versus nine predicted by chance), indicating a far larger subset of funds that are either expensive or run by unskilled fund managers.
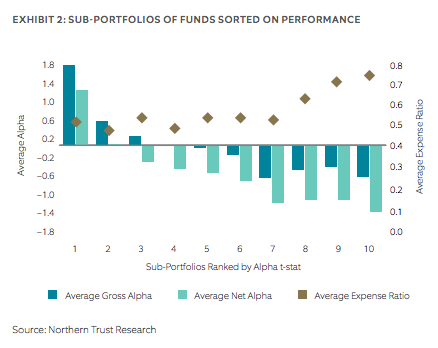
We sorted our sample into 10 sub-portfolios based on performance ranked by alpha t-stats, where Portfolio 1 has the highest alpha t-stats (top performers) and Portfolio 10 has the lowest alpha t-stats (bottom performers). Exhibit 2 shows the average gross and net-of-expense alphas (left scale) and expense ratios (right scale) for each of the 10 sub-portfolios.
We find gross positive alpha (both robust and random) in only the top three
performing sub-portfolios. And we find positive alpha net of expenses (both robust and random) in only the top one (or perhaps two) performing sub- portfolio(s). We also observe that the highest expense ratios are in the worst performing sub-portfolios (Portfolios 8 – 10).
IMPLICATIONS FOR PORTFOLIO CONSTRUCTION
In contrast to the conventional wisdom, the overall evidence suggests that municipal bond markets are highly competitive. Mispricing is not systematic and must be rather uncommon because the average fund alpha equals expenses and robust positive alphas are very rare. Common term and credit risk explain the compensated return and risk of active municipal bond funds. This is good news for investors because it suggests that competitive municipal bond markets dynamically price a close positive relationship between expected return and risk.
Therefore, municipal portfolio construction should focus primarily on the consistent targeting of desired term and credit exposures. This approach considers other risk factor exposures (especially market risk) across the broader investment portfolio. The main value of a municipal bond fund manager is to capture these betas efficiently, and with broad issuer diversification.
Lifetime financial goals are typically inflation-sensitive, so municipal inflation- protection is another consideration for municipal portfolio construction. Desired inflation-protection and term and credit exposures are a function of the investor’s unique risk preference and/or the unique character of his or her lifetime financial goals (liabilities).
Peter Mladina is director of portfolio research for Wealth Management at Northern Trust.
David Moore, CFA, CAIA, is senior analyst at Northern Trust Wealth Management.
Steve Germani, CFA, CFP, is senior analyst at Northern Trust Wealth Management.