


The search for yield has become expensive (see Chart 4), and the current S&P 500® P/D ratio (the inverse of yield) is in only the 25th percentile based on eighty years of data. In other words, dividend investing has been more attractive during 75% of the quarters over the last 80 years. The current high P/D ratio indicates that investors are paying a high valuation for dividends. The stock market’s volatility during the past year, however, puts the stock market’s 12-month price performance in the 81st percentile, meaning that 12-month returns have been worse than that of the last 12 months only 19% of the time (see Chart 5). With dividends expensive and price appreciation well below the norm, we think it might favor investors to change tactics and lean toward capital appreciation.
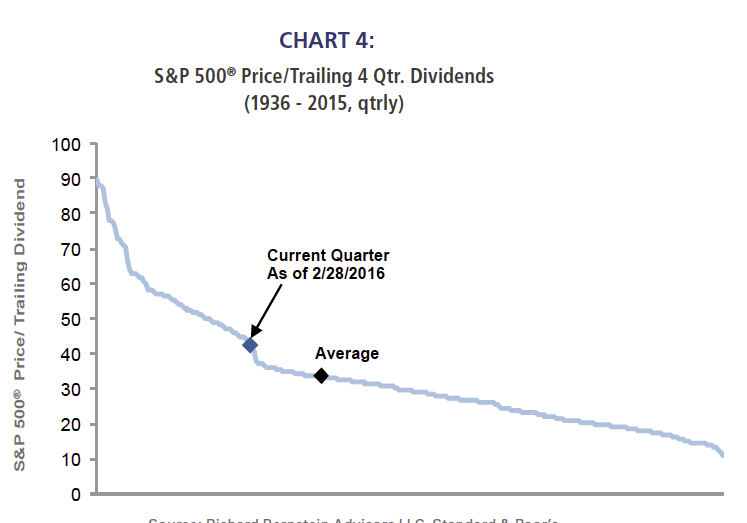
Source: Richard Bernstein Advisors LLC, Standard & Poor’s
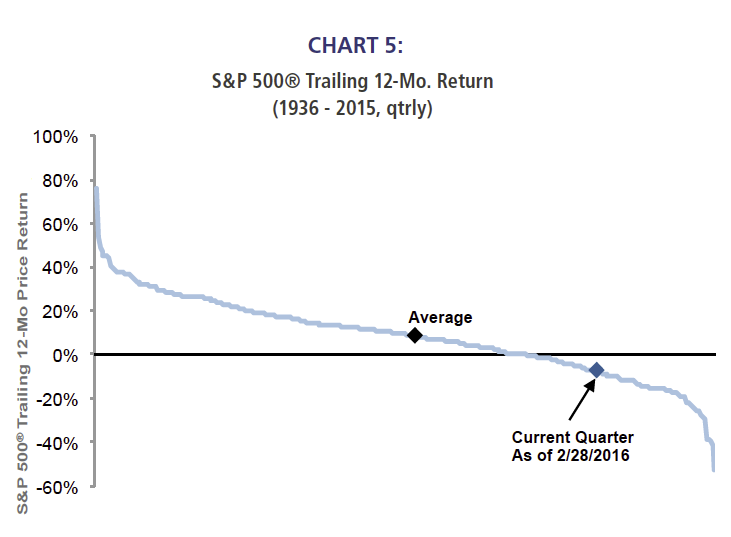
Source: Richard Bernstein Advisors LLC, Standard & Poor’s, Bloomberg L.P.
No guts, no glory
Capitalism is based on taking risk and being compensated for taking that risk. Within that context, investors who are always afraid and structure portfolios conservatively because of that fear should expect sub-par returns. Investors are herding because of fear, and not because of greed. Accordingly, income strategies are much more popular than are strategies based on capital appreciation.
We strongly doubt that investing with the income herd will prove fruitful. Rather, we think investors should be looking to step away from the crowd, and better balance portfolios between income and capital appreciation. There is nothing wrong with income investing, but the opportunity cost of investing in fear and giving up potential capital appreciation might be substantial.
No one ever grew wealth being scared.
INDEX DESCRIPTIONS:
The following descriptions, while believed to be accurate, are in some cases abbreviated versions of more detailed or comprehensive definitions available from the sponsors or originators of the respective indices. Anyone interested in such further details is free to consult each such sponsor’s or originator’s website.
The past performance of an index is not a guarantee of future results.
Each index reflects an unmanaged universe of securities without any deduction for advisory fees or other expenses that would reduce actual returns, as well as the reinvestment of all income and dividends. An actual investment in the securities included in the index would require an investor to incur transaction costs, which would lower the performance results. Indices are not actively managed and investors cannot invest directly in the indices.
MSCI All Country World Index (ACWI®): The MSCI ACWI® Index is a widely recognized, free-float-adjusted, market-capitalization-weighted index designed to measure the equity-market performance of developed markets.
S&P 500®: Standard & Poor’s (S&P) 500® Index. The S&P 500® Index is an unmanaged, capitalization-weighted index designed to measure the performance of the broad US economy through changes in the aggregate market value of 500 stocks representing all major industries.
U.S. Small Caps: Russell 2000 Index. The Russell 2000 Index is an unmanaged, capitalization-weighted index designed to measure the performance of the small-cap segment of the US equity universe. The Russell 2000 Index is a subset of the Russell 3000® Index.
Europe: MSCI Europe Index. The MSCI Europe Index is a free-float-adjusted, market-capitalization-weighted index designed to measure the equity-market performance of the developed markets in Europe. The MSCI Europe Index consists of the following 16 developed market country indices: Austria, Belgium, Denmark, Finland, France, Germany, Greece, Ireland, Italy, the Netherlands, Norway, Portugal, Spain, Sweden, Switzerland, and the United Kingdom.
No One Ever Grew Wealth Being Scared
March 7, 2016
« Previous Article
| Next Article »
Login in order to post a comment