


The reality of writing a regular blog is that sooner or later you’ll repeat yourself. For the umpteenth time in recent memory, volatility has slouched to a level that should set off at least a few alarm bells. Markets have been eerily calm of late, with the VIX Index, a commonly used measure of U.S. equity volatility, currently in the low teens.
Volatility is not just low in an absolute sense. More importantly, it is too low relative to the factors that have historically driven market volatility. Those include:
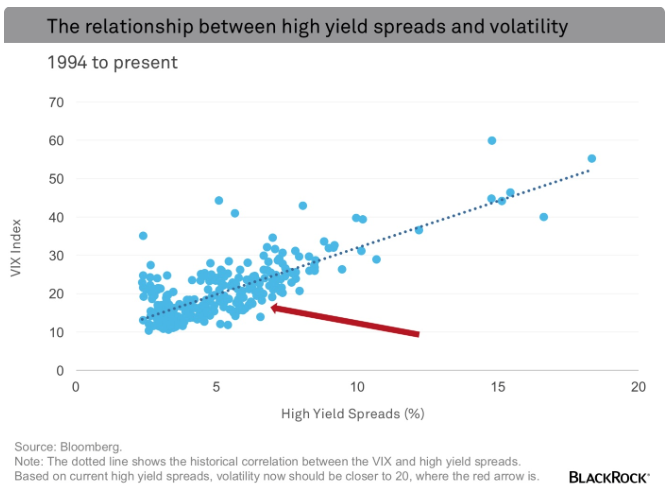
Credit Market Conditions
Credit market conditions have historically had the tightest correlation with market volatility (see the dotted line in the chart below). When credit markets are struggling, indicated by wider spreads, volatility is almost always elevated. High yield spreads have come in dramatically since the January panic, but volatility has declined at an even faster rate. Based on high yield spreads, which have historically explained about 60% of the variation in the VIX, volatility should be closer to 20 (see the arrow in the chart below) than the low teens.
Economic Conditions
Markets are more likely to be calm when economic conditions are improving. In contrast, recessions almost always correlate with down markets and rising volatility. That is why the VIX Index has historically correlated with leading indicators. Since 1990 the level of the Chicago Fed National Activity Index (CFNAI) has explained nearly 25% of the variation in the VIX. While the CFNAI has stabilized, it still suggests that the VIX is roughly 25%-30% too low.