


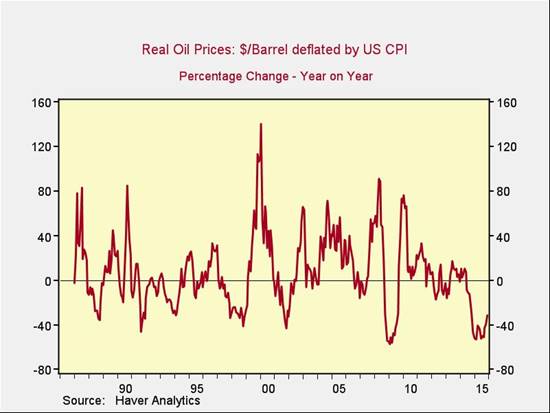
In fact, though the current decline is exceptionally severe, it is comparable with many other price drops, including those of 2009, 2002, 1999, 1991, and 1989.
We can draw two conclusions from this chart:
• First, the bottom of the price decline is typically about a year after a significant economic slowdown or market decline. In other words, the decline does not lead such an event, it follows it. If this drawdown is typical, the bottom in oil prices means that the worst economic and market weakness may be behind us, not in front of us.
• Second, in every similar decline there was a spike, in the next year or so, of at least 30 percent—and usually much more—as markets normalized. Again, if the oil market behaves like it has in the past, we can expect prices to move sharply higher over the next couple of years.
Is this a guarantee? Of course not. But, if we consider that oil is now at a price level that has been sustainable for decades, the possibility of global economic collapse isn’t as much of a concern—and the idea of a price recovery seems more reasonable. And if we consider that price drops like this one are not unprecedented (and not even uncommon), it frees us to consider the next step.
History suggests that the next step is a price recovery, and probably a substantial one. Such a recovery could return prices to levels that are still economically stimulative while also bringing the energy sector back to life. With prices where they are now, that looks to me like a very real opportunity.
Brad McMillan is the chief investment officer at Commonwealth Financial Network, the nation’s largest privately held independent broker/dealer-RIA. He is the primary spokesperson for Commonwealth’s investment divisions. This post originally appeared on The Independent Market Observer.