Key Points
- Since the start of November the global stock market has been retracing the pattern seen in the second half of last year. That pattern suggests an end to the rally, but there are reasons to believe it may not be over yet.
- Key differences between the current rally and the one that failed last fall are support from a weaker dollar compared to emerging market currencies, increasing commodity prices, and better-than-expected economic data in some countries.
- The three major risks to the rally are: the return of dollar strength, the return of weakness in oil/commodity prices, and a return to disappointing economic data.
Since the start of November, the global stock market has been retracing the pattern seen in the second half of last year, as you can see in the chart below. Last week marked an important test of that pattern, because at this point in the pattern last fall the rally began to fail and stocks resumed their decline. However, it appears stocks have passed the test given by the series of major central bank meetings last week and have continued to post gains. There are reasons to believe the stock market may rally for at least for a little while longer, but the risks to the rally are worth watching.
Déjà vu: Will global stocks continue to retrace the pattern from last fall?
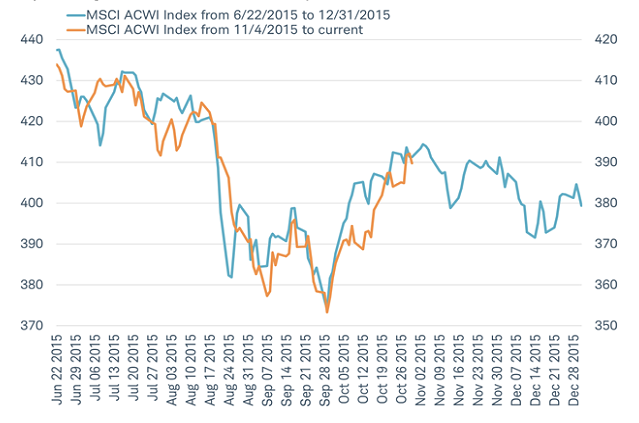
Source: Charles Schwab, Bloomberg data as of 3/20/2016.
Key differences between the current rally and the one that failed last fall include support by a weaker dollar compared with emerging market currencies, increasing commodity prices, and better than expected economic data in some countries. These factors helped mitigate concerns about risks posed by dollar denominated debt in emerging markets, the weakness in credit markets driven by falling revenues for commodity-driven businesses, and fears of a global recession. The sense of investor relief prompted the “fear gauges,” the volatility indexes for the major stock markets, to ease back to near normal levels after a surge in January and early February, as you can see in the chart below.
“Fear gauges” have eased back to near normal levels
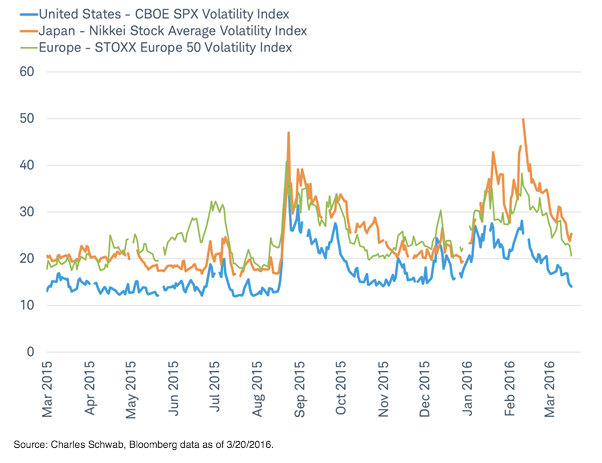
Source: Charles Schwab, Bloomberg data as of 3/20/2016.
An inherent weakness of the rally is a lack of accompaniment from fundamental improvements in economic or earnings growth. If this doesn’t change, the market gains will be limited to a mere relief rally. However, there is evidence that expectations for economic and earnings growth may have fallen too low and this rally may have more room to run in the near-term.
The economic data this year in the United States, Europe, and Japan had generally been coming in weaker than expected, as evidenced by the decline in the Citigroup economic surprise indexes. These indexes decline when economic data is falling short of economists’ expectations and rise when it exceeds estimates. However, in recent weeks the surprise index for the United States has seen a sharp rebound; in Europe it is starting to turn up; and in Japan it may be bottoming, as you can see in the chart below.
Economic data is no longer disappointing economist expectations
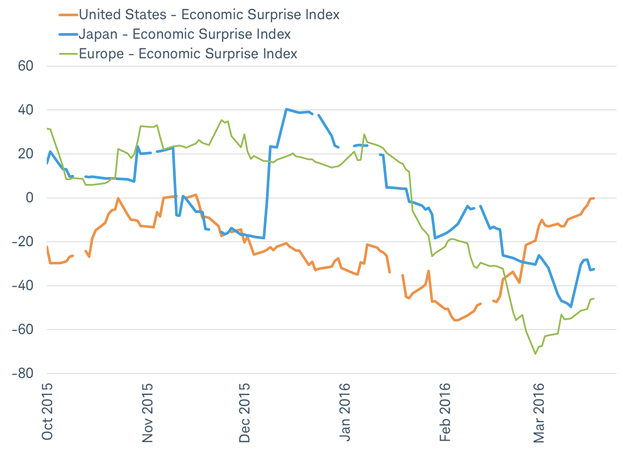
Source: Charles Schwab, Bloomberg data as of 3/20/2016.
The bottoming of expectations for the world’s major economies could help sustain the relief rally since history shows us that economic data doesn’t have to be strong for stocks to rise, it just has to be better than expected. Stocks that benefit from an upturn in growth, such as stocks in economically sensitive sectors, small cap stocks, and emerging market stocks (which just entered a bull market with a 20% rebound from the January low in the MSCI Emerging Market Index) have been leading the rally.
Risks to the rally
Global stocks have rebounded to the middle of their two-year range, as measured by the MSCI AC World Index. We must now watch for risks to the rally and the return of downside volatility. Given recent market drivers and the fact that major central bank meetings took place last week, the three major risks to the rally now are: the return of dollar strength, the return of weakness in oil/commodity prices, and a return to disappointing economic data.
A return of dollar strength versus emerging markets. While the European Central Bank and the Bank of Japan continue to push yields into negative territory, the U.S. dollar index (which measures the value of the dollar primarily against the euro and yen) has been range-bound since March 2015. Over the past two months, the dollar began to slide, as measured against emerging market currencies after rising by more than 20% over the prior two years. The longer the respite from a rising dollar lasts, the better it is likely to be for investor sentiment.
The return of weakness in oil prices. The recent stability in oil prices, with brent crude rebounding to around $40 per barrel after falling to $28, has been accompanied by producers’ talk of freezing output and a report from the International Energy Agency that indicates signs that “prices may have bottomed out,” with supply and demand potentially returning to balance in 2017. However, talks of supply cuts may not turn into action and demand growth may weaken further, pulling prices back down. The longer oil prices remain relatively stable, the more support for the stock market rally.
The return of disappointing economic data. While expectations may now be low enough that economic data can continue the recent trend of exceeding estimates, it is possible that renewed weakness or upwardly revised expectations may lead to the return of disappointing data. The longer the surprise indexes can avoid a renewed decline, the more support for the rally.
We continue to believe 2016 will be a year of heightened market volatility. While the early weeks of the year the volatility was to the downside, the past month or so has seen that volatility on the upside. For now, the relief rally in risk assets remains intact, but the dollar, commodities, and economic data will be critical to sustaining it.
Jeffrey Kleintop is senior vice president and chief global investment strategist at Charles Schwab & Co.