Key Points
- As April comes to a close, investors are again wondering whether to “sell in May and go away”
- Investors will also be hearing a lot about the Dow’s new “Golden Cross”
- Our conclusion is that signals are mixed and now is not the time to take on undue risk.
As most readers know, I always title my reports with a fitting song title. Sadly, this year I’ve opted to choose one to honor a fallen music legend, like David Bowie and Glen Frey. This week, it’s an ode to the late-great Prince—a life gone too soon.
Back to business
We are in that “season” when you will hear a lot about whether it’s appropriate this year to “sell in May and go away,” which is one of the most time-honored market adages, and for good reason. Since 1950, nearly all of the S&P 500’s gains have occurred between October and April. As you’ll see detailed in the tables below, the mean return since 1950 for the S&P 500 during May through October was 1.3%; while for November through April it was 7.1%.
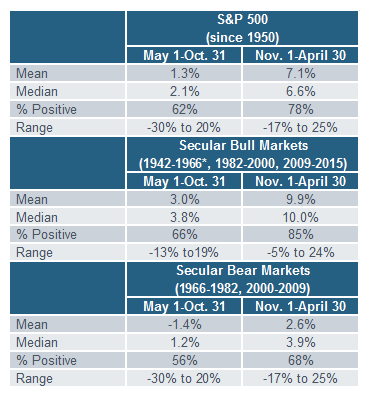
Source: Ned Davis Research (NDR), Inc. (Further distribution prohibited without prior permission. Copyright 2016© Ned Davis Research, Inc. All rights reserved.), as of October 31, 2015. *Data postdates 1942-1966 secular bull market.
In terms of the growth of $10,000, you can more clearly see the vast spread between how the market’s performed in these two six-month periods.

Source: Ned Davis Research (NDR), Inc. (Further distribution prohibited without prior permission. Copyright 2016© Ned Davis Research, Inc. All rights reserved.), as of October 31, 2015.
Caveats
The “strategy” did not work for the three years from 2012-2014, or for the five years from 2003-2007, when there were gains between May and October in each year. In addition, as you can see in the tables above, there is a meaningful difference between how the market performs from a seasonal perspective in secular bull or secular bear markets. Average gains and the percent of positive cases have been higher in secular bulls than in secular bears (even if they are still lower than in the November through April period).
Golden Cross not as golden as perceived
Ostensibly supporting the bull case as we head toward May, is another market metric which will undoubtedly get some attention this week. The Dow Jones Industrial Average just experienced a so-called “Golden Cross.” This is a technical term used to describe the 50-day moving average crossing above the 200-day moving average as both moving averages are rising. As you can see in the chart below, this just occurred again and it’s the first Golden Cross for the Dow since January 2, 2012. It’s generally seen as a very bullish indicator for stocks…but is it?
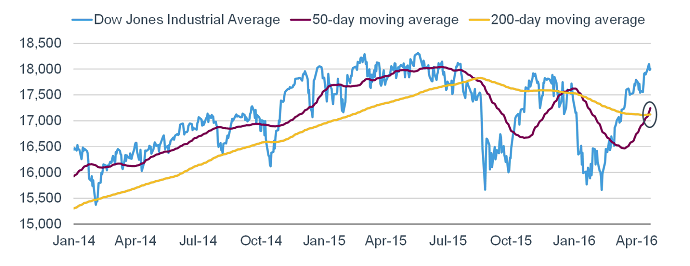
Source: FactSet, as of April 22, 2016.
Bespoke Investment Group (BIG) took a look at the past 50 years to see how the market fared in the aftermath of Golden Crosses. As you can see by looking at the average and median returns at the bottom of the table below, performance following Golden Crosses was no better than the performance over any random time period. It was up exactly half the time over the next month and three months; while returns and probabilities did increase for the six-month period.
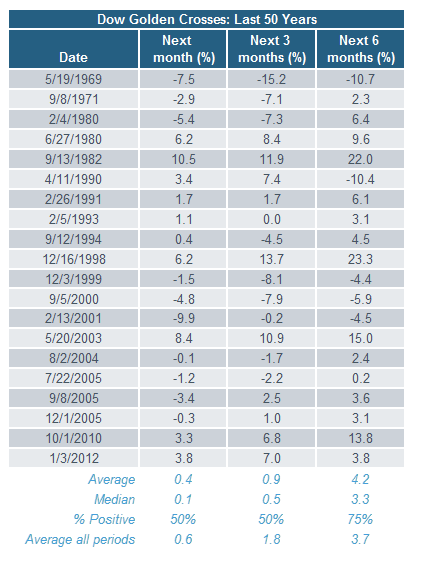
Source: Bespoke Investment Group (BIG), as of April 22, 2016.
If you are looking for the glass-half-full perspective, do note that the Dow performed very well following the last two Golden Crosses in October 2010 and January 2012; while the Dow was positive in the six months after the last seven Golden Crosses as well.
Also on the subject of 200-day moving averages
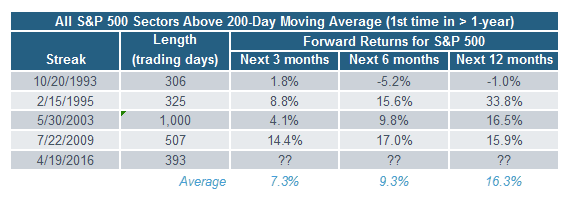
Another feat by the market last week was the continued improvement in market breadth (which has been much healthier than other rallies over the past year). Last week, the Financial sector finally regained its 200-day moving average, which now puts all 10 S&P 500 sectors above their 200-day moving averages.
The recent streak of over a year without all 10 sectors above their 200-day moving averages simultaneously is rare. According to BIG, there have only been four previous streaks of a year or more since 1990; and two of those were coming out of major bear markets. As you can see in the table below, this sign of improving breadth was an extremely bullish signal in three of the past four instances (1993 had mixed results).
Source: Bespoke Investment Group (BIG), as of April 22, 2016.
Competing forces
The net is that there are competing forces at work for the market at present. From the February low, the market has rallied sharply, which has triggered indicators like the Golden Cross. BIG looked back over the Dow’s entire history to find times when the Dow closed at a 52-week low at some point in the prior three months, then rallied at least 13% over a 50-day period. The last two times this occurred were in October 2011 and November 2015—both marked short-term highs in stocks.
However, the current experience is unusual because it’s the second occurrence within a year. The other times that happened (November 1900, October 1921, July 1932 and November 2001), stocks did markedly better.
To me, these conflicting forces suggest maintaining our “neutral” rating on U.S. stocks. That means investors should remain at their strategic equity allocation, but be extra mindful of adopting rebalancing strategies in the interest of risk control.
Liz Ann Sonders is senior vice president and chief investment strategist at Charles Schwab & Co.