


Key Points
- While most states have high and stable credit ratings, slowing tax revenue growth is a potential warning sign.
- We don’t believe you should avoid state municipal bonds altogether—just be selective about where you invest.
- Local general obligation bonds that rely on property values may be better positioned from a credit perspective at this point in the economic cycle.
State tax revenue growth has been slowing, and that’s a warning sign to us. Most state governments rely on revenue sources that are closely tied to the current state of the economic cycle to fund operations and pay debt service on bonds.
Although you shouldn’t avoid state municipal bonds, it’s a good idea to be selective about where you invest. We favor bonds issued by cities, counties and school districts, relative to state municipal bonds, because we believe they may be better positioned from a credit perspective at this point in the economic cycle. A few points to consider:
State tax revenue growth is declining
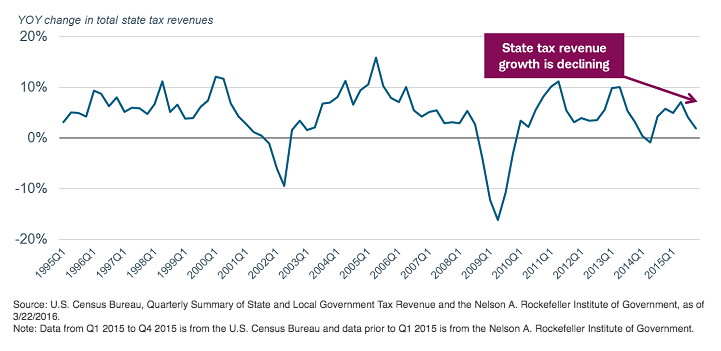
Note: Data from Q1 2015 to Q4 2015 is from the U.S. Census Bureau and data prior to Q1 2015 is from the Nelson A. Rockefeller Institute of Government.
1. Although revenue growth is slowing, it’s not all bad news for state muni bonds. Generally, state credit quality is high and ratings are stable. Of the states rated by Moody's Investors Service and Standard & Poor’s, only two have ratings below Aa3 (Moody’s) or AA- (S&P): Illinois (Baa1/A-) and New Jersey (A2/A). In fact, over 80% of states have one of the three highest ratings possible:
Aaa/AAA, Aa1/AA+ or Aa/AA. We believe the high ratings mean that most states have more-than-adequate resources to pay the debt service on their outstanding bonds.
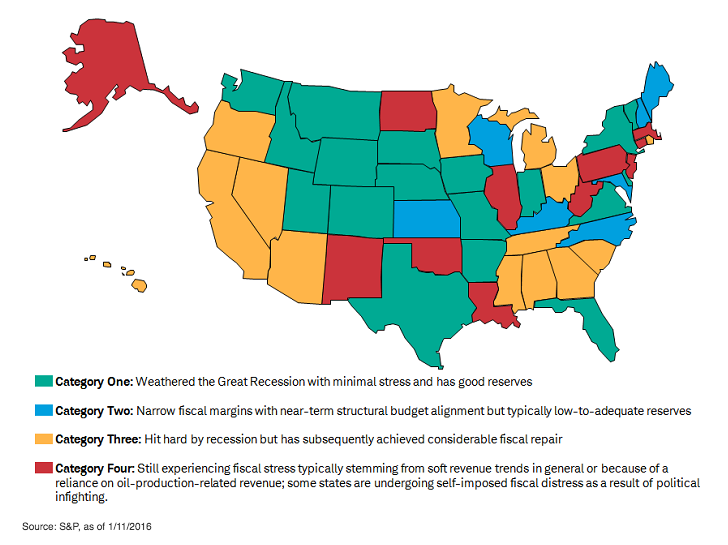
2. Recovery and economic cycle varies by state. Slowing revenue growth may be an impediment for states with less financial flexibility. State revenues substantially declined during the 2007-2009 Great Recession, but have since largely recovered. However, the recovery has not been uniform among all states. S&P recently released a report on state credit quality that argues that the states that have improved their credit quality the most have shown spending restraint and even increased tax rates. The map below shows S&P’s view regarding each state’s fiscal conditions at the start of 2016.
State fiscal conditions at the start of 2016
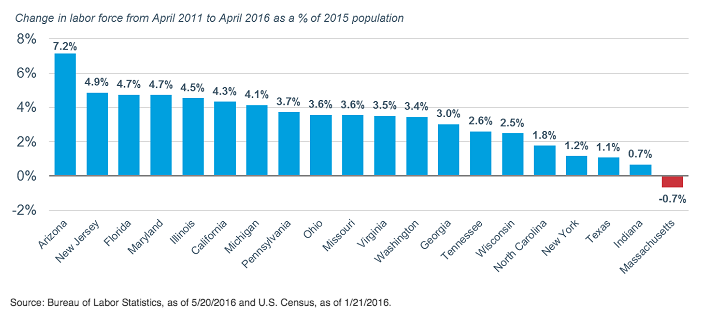
3. We believe state municipal bonds should still be considered as part of a diversified municipal portfolio, but that you should be selective in where you invest. We don’t suggest investing in just any state municipal bond. The states that have seen the largest declines in revenues have generally had a dependency on either capital gains taxes or on the oil-and-gas industry. Also, we would be more cautious of states where employment growth is weak. Employment is only one piece of the economic health of a state, but a stable or growing employment base is usually supportive of tax revenues.
A growing labor force is generally supportive of a healthy economy
4. Local government bonds may be better positioned from a credit perspective at this point in the economic cycle. In aggregate, sales taxes and income taxes—including capital gains—make up approximately 90% of state tax revenues nationally. These two sources of revenues are generally linked to the current state of the economy. Local government revenues, on the other hand, tend to lag economic growth, and are still favorable, in our view. For the majority of states, we do not believe that the slowdown in revenues, on its own, will lead to ratings downgrades and potentially lower prices on their bonds. But at this stage of the economic cycle, we favor local government obligation bonds.
Usually the source for repayment of local general obligation bonds is the municipality’s full taxing authority and its pledge to use all necessary resources to pay the bonds back. Property taxes are often the bedrock of local government tax revenues. Property taxes lag economic growth because they are derived from the assessed value, rather than the market value, of a home. A Federal Reserve study found that it takes three years on average for the change in market value to flow through to the assessed value and property tax revenues for the local government.
Since the lows in 2012, home prices have increased by more than 36%1. Therefore, the growth in home values should continue to play itself out on the balance sheets of local governments going forward. This is a favorable trend for credit conditions for local governments. Some municipalities, however, may have legal restrictions on how much they can increase taxes. For more information, we suggest reviewing the bonds’ legal documents, which can be found on Schwab.com.
What to do now
Tax revenues used to pay municipal bonds, including local general obligation bonds, largely reflect the economics of the region. When looking for individual local government general oblation bonds, we would suggest starting with the following considerations:
Pick highly rated bonds. Choose bonds with a rating of A (Standard & Poor’s) or A2 (Moody’s), or better, before accounting for bond insurance.
Diversify. No more than 10% of your portfolio should consist of any single issuer.
Know the terrain. Focus on areas that have stable or steadily increasing populations. Those close to diverse and growing employment centers are also more attractive.
Focus on jobs. Invest in areas not dominated by one industry. Areas that have a diverse economy are generally less vulnerable to economic shocks. In addition, they tend to recover more quickly from economic declines.
Identifying bonds with these characteristics can be difficult. If you would like help, we suggest speaking with a Schwab Fixed Income Specialist or consider using a professional bond portfolio manager such as a mutual fund.
Cooper J. Howard, CFA, is senior research analyst, fixed-income and income planning, at Charles Schwab & Co.
Rob Williams is director of income planning at the Schwab Center for Financial Research.