KEY TAKEAWAYS
· Longer-term technical indicators on equities continue to look very strong.
· Overall market sentiment could be a nice contrarian reason to remain bullish.
We take a closer look at market technicals and sentiment this week with the historically volatile second half of October upon us. Although there has been some near-term volatility and equity weakness, the longer-term technicals on equities continue to look very strong. We will show this by examining three different technical indicators that, combined, show the potential for positive longer-term signals for equities. Turning to overall market sentiment, the overwhelming evidence suggests there is still a significant amount of worry about future price returns. From money leaving equity funds, to market sentiment polls showing an unusually high level of worry this close to all-time highs, sentiment could potentially be a nice contrarian reason to remain bullish.
Technical Analysis is a methodology for evaluating securities based on statistics generated by market activity, such as past prices, volume and momentum, and is not intended to be used as the sole mechanism for trading decisions. Technical analysts do not attempt to measure a security’s intrinsic value, but instead use charts and other tools to identify patterns and trends. Technical analysis carries inherent risk, chief amongst which is that past performance is not indicative of future results. Technical Analysis should be used in conjunction with Fundamental Analysis within the decision making process and shall include but not be limited to the following considerations: investment thesis, suitability, expected time horizon, and operational factors, such as trading costs.
Bullish Longer-Term Technicals
Best practices in technical analysis recommend looking for confirmation from multiple technical perspectives. The ability to have multiple technical analysis indicators confirm each other helps raise the probability of success in assessing future market direction. We have outlined three longer-term technical indicators below which together increase the level of confidence that equities move higher over the next 6 to 12 months.
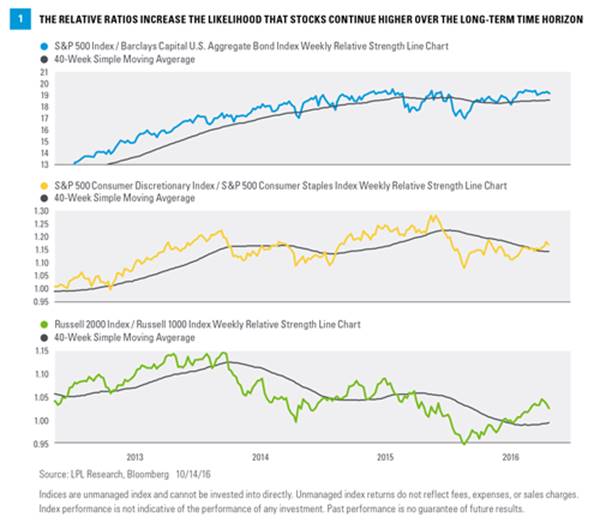
Relative ratios remain bullish. The following relative strength ratios, based on historical data, can be used to gauge the probability of success in forecasting the potential future direction of the stock market [Figure 1].
· Stocks versus bonds. The stocks-versus-bonds ratio is helpful in assessing trends in the overall stock market. A rule of thumb is that when stocks outperform bonds it generally depicts a bullish trend for stocks.
Looking at historical data going back to 2004, when the weekly reading on the S&P 500 Index / Barclays Capital U.S. Aggregate Bond Index relative strength line chart is sustained above its 40-week simple moving average (SMA) for three trading weeks, subsequent long term price levels on the S&P 500 index tended to rise. Since 2004, this type of moving average crossover happened only 8 times. Six months later, the S&P 500 was higher 6 of 8 times (75%), with average total returns of 5.7%. Going out nine months, the returns are higher 8 of 8 times (100%), with average total returns of 9.2%. Looking out one year, the returns were higher 7 of 8 times (88%), with average total returns of 7.0%.
· Consumer discretionary versus consumer staples. When the consumer discretionary index outperforms the consumer staples index, it indicates that the market favors goods that consumers choose to buy (i.e., discretionary) over items that they must buy (i.e., staples). This is evidence of the market’s confidence in consumer spending, and the economy as a whole.
Looking at historical data going back to 2003, when the weekly reading on the S&P 500 Consumer Discretionary Index / S&P 500 Consumer Staples Index relative strength line chart is sustained above its 40-week SMA for three trading weeks, the S&P 500 index has tended to rise over the long term. Since 2003, this type of moving average crossover happened only 14 times. Six months later, the S&P 500 was higher 10 of 14 times (71%), with average total returns of 6.5%. Going out nine months, returns were positive 12 of 14 times (86%), with average total returns of 10.5%. Looking out one year, the returns were positive 11 of 14 times (79%), with average total returns of 10.5%.
· Small caps versus large caps. When the small cap index outperforms the large cap index, it can be reflective of a growing stock market due to the increased investment into small business.
Looking at historical data going back to 2003, when the weekly reading on the Russell 2000 Index / Russell 1000 Index relative strength line chart is sustained above its 40-week SMA for three trading weeks, subsequent long term price levels on the S&P 500 index tended to rise. Since 2003, this type of moving average crossover happened only 13 times. Six months later, the S&P 500 was higher 8 of 13 times (61%), with average total returns of 2.5%. Going out nine months, returns were positive 11 of 13 times (85%), with average total returns of 5.5%. Looking out one year, returns were positive 10 of 13 times (77%), with average total returns of 9.1%.
Bullish Combination
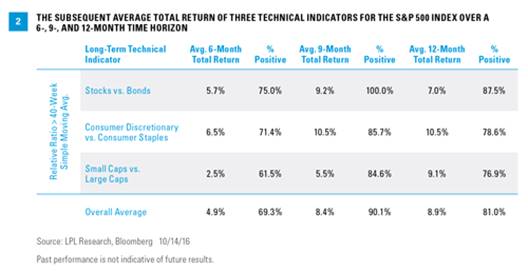
The combination of the three aforementioned technical indicators increases the likelihood that stocks will move higher over the next six to 12 months. Taking an overall average of the indicators, six months later, the S&P 500 was higher 69% of the time, with an average total return of 4.9%. Going out nine months, returns were positive 90% of the time, with average and median returns of 8.4%. Looking out one year, the returns were positive 81% of the time, with average and median total returns of 8.9% [Figure 2].
Investor Sentiment
We also find value in assessing investor sentiment. History has shown that the crowd can be right during trends, but tends to be wrong at extremes. Sentiment can be used as a contrarian indicator, because if everyone who might become bearish has already sold, only buyers are left. This, of course, applies to the reverse as well.
Sentiment polls are one way to gauge investor sentiment, and so far this year we’ve seen an unusually high level of fear. For instance, the American Association of Individual Investors (AAII) Sentiment Poll has seen the percentage of bulls below 30% for eight consecutive weeks. That is the second longest such streak in 22 years. Additionally, going back to 1987 when the weekly poll started, the average number of bulls has been 38.5%. Incredibly, the bulls have come in below this number for a record 49 straight weeks, trouncing the previous record of 33 straight weeks.
Fund Flows
What are investors doing with their money? A sentiment poll is one thing, but we can also gauge sentiment by watching where the assets are moving. The data show that investors are very skeptical of equities here, evident by the record 32 straight weeks of outflows from domestic equity mutual funds according to the Investment Company Institute. The previous record was 25 straight weeks ending in late 2010, when many investors were still looking for a double-dip recession. Where is all this money going? Much of it is moving into bonds, as 31 of the previous 32 weeks have seen inflows into bond mutual funds.
What about adding exchange-traded funds (ETFs) to the picture? It is no secret that many of the outflows from equity mutual funds have moved into equity ETFs. As shown in Figure 3, so far this year the combined outflows from domestic mutual funds and ETFs are $89.1 billion, with only March and July showing small inflows. Now compare that to the combined bond inflows into mutual funds and ETFs of $199.9 billion, with every month positive so far in 2016. Equities aren’t the crowded trade; in fact, it could be bonds.
Conclusion

As we laid out in our Midyear Outlook 2016, we expected market volatility to pick up in the second half of the year but for stocks to still finish with mid-single-digit gains.* Although there are many well-known concerns that could lead to equity weakness, generally positive technical indicators and an overriding sense of worry among investors can be a powerful combination. We would expect any near-term market declines to potentially be shallow and short lived, and would likely view them as potential buying opportunities. Should the myriad of investors’ worries not unfold and the economy pick up some steam, the strong technical backdrop could potentially indicate more stock market gains lie ahead.
Burt White is chief investment officer for LPL Financial.