Over the last 10 years or so, there has been intense speculation about the size, scale and scope of the boomer retirement market. Speculate no more.
Beginning in 2010, the first group of boomers reached retirement age. It is now time to properly characterize this generation of Americans born between 1945 and 1964 so that advisors can truly appreciate the colossal nature of the task at hand.
In 2010, baby boomers could be divided into two age groups: those between 55 and 64 and those age 45 to 54. For distinction, we'll classify the first group, born between 1945 and 1954, as "old boomers" and the latter as "young boomers."
The Size Of The Current Pre-Retiree Market
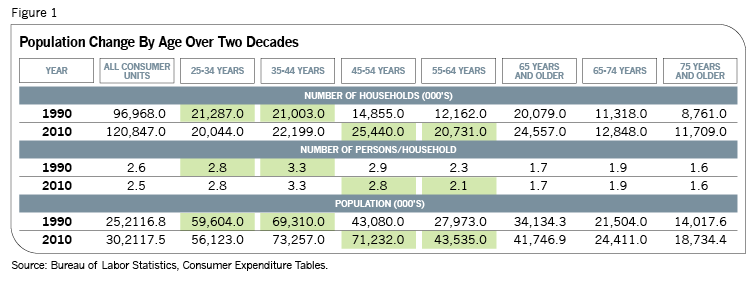
Let's start with the composition and size of the age bands over time. Figure 1 illustrates the makeup and size of the boomer market, highlighted in light green.
There are some immediate and striking observations. Between 1985 and 2010, all age groups increased in size as the U.S. population went from 238 million to 302 million. Oddly, the only group to defy this trend has been the 65-74 group, which has remained about the same size. Also striking is the change in household sizes. Today's boomers have significantly fewer dependents living at home than the pre-retirees of 25 years ago. However, since the 2008 financial crisis, this trend has slightly reversed, probably reflecting the large number of young unemployed who have moved back in with their parents to save rent money.
In 2010, there were about 42 million Americans aged 65 and older. As boomers retire, this market will swell to about 110 million by 2030, nearly tripling in size. Furthermore, the current pre-retirement market is about 65% bigger than what it was 20 years ago. Unfortunately, this group is woefully underprepared for retirement, more than any group before them if we compare their retirement savings to their current expenditures.
The Boomer Doomer
For retirement savings data, we turn to Employee Benefits Research Institute (EBRI) reports. For 2010, EBRI data shows that people over 60 employed for 30 or more years had about $200,000 in their 401(k) accounts, while people in their 50s are poised to retire with similar account balances. Even if we didn't take living costs into account, it is obvious that these amounts are inadequate, even for two-income families. Moreover, the time required to undo such gross errors is running out.
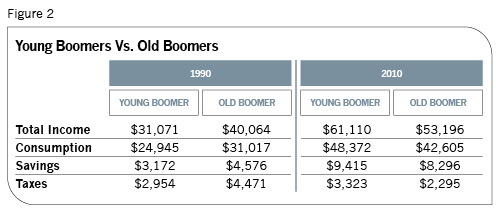
To understand how we got here, we must look into the lifestyles of boomers and the amounts they are spending today to finance their lifestyles. Figure 2, again using BLS data, shows the income of boomers and how it is accounted for using standard GDP guidelines.
In 1990, young boomers were earning about $31,000, consuming nearly 80% of that, saving 10% (including retirement contributions) and paying another 10% in taxes. By 2010, these same young boomers demonstrated nearly the same consumption pattern as before, while their personal savings were up at 15%, and personal taxes were down to only 5% of their total income. It is interesting to see that this group of young boomers maintained their living standards (consumption-to-income ratios) throughout the years. Even the 2008 crisis did not change their basic saving/spending behavior.
Similarly, in 1990, old boomers were consuming about 77% of their income, saving 11.5% and paying 11.5% in taxes. By 2010, this group had actually increased their consumption to 80%, while their savings were at 15.5% and their taxes at 4.5%. Increasing proportional consumption over savings during very, very financially troubled times is very curious behavior indeed. Obviously, this group of old boomers is totally clueless about what lies ahead after retirement. They seem to have little or no understanding about the funds required to maintain their lifestyles in retirement. Furthermore, the proportion of taxes paid by young boomers were halved between 1990 and 2010 while old boomers' taxes went from 11.5% of income to just over 4%. This tax trend was not limited to boomers. Across the nation, taxes fell from an average of 9.4% to just 4% between 1990 and 2010.
It is heartening to note such a reduction-which champions the market economy. (It also shows clearly the distinction between marginal and average tax rates for laypeople, which might help a presidential hopeful like Mitt Romney explain the major tax contribution of a 15% tax rate.) But from an advisor's standpoint, this is disconcerting news.
Even two-income families are woefully unready. Consider the current realities for income securities: The risk-free benchmark rate for 10-year Treasurys is hovering around 2% while the 30-year benchmark is around 3%. Under these conditions, if we assume boomers cannot afford to take speculative risks with their retirement funds, a return of 3% on $400,000 would give back about $12,000 in risk-free earnings. Compare this to the $39,000 boomers would actually need to maintain their lifestyles in retirement (with an 80% replacement ratio of their current income) and the problem becomes crystal clear. A risk-free retirement portfolio would only be covering about 30% of their lifestyle needs! Could people really pare down their expenses by 70%? How much worse would it be if we explored single-income families?
It's infeasible to solve the problem by seeking a higher rate of return from our investments. Large-cap stocks are currently expected to return about 7% to 8%. Even this high rate leaves an income shortfall of about 20%, and meanwhile, investors in these securities face greater risk. Given that the S&P 500's volatility is about 30% higher than it was in the decade before 2008, a family of two with just $400,000 in savings cannot afford to take any chances. In fact, under these conditions, average boomers should conserve and stretch this meager principal as best they can.
There seems to be no way out except one. For prudent advisors whose clients are not all in the high-net-worth category (we will address this group's issues later), the only alternative is to start changing the clients' current lifestyles significantly and helping them save every last penny they can find. Furthermore, they need to invest these savings in a very prudent way, their main objective being principal conservation. One way is to seek out lower-risk fixed-income type cash flows, perhaps in deferred and fixed annuities. These cash inflows can then be matched with future critical outflows for health care and other basic (non-discretionary) living costs. It is the advisor's fiduciary responsibility to ensure that the future cash flows are not spent on discretionary expenses. Those advisors who can guide unsuspecting average boomer citizens out of harm's way are worth their weight in gold.
Advisors must also watch a client's consumption patterns as he or she slips into retirement. Typically, as family sizes shrink and retirees age, their consumption declines in most categories: Expenditures on food, housing, transportation, entertainment, etc. all go down along with income, savings and taxes. The only category that continues to rise, sharply, is health-care expenses. For example, young boomers spent about 4% on health care in 1990. This grew to 7% in 2010. Similarly, for old boomers proportional health-care spending rose from 4.5% to 9% in the same period. In 2010, people over 65 years of age were spending about 13% of their total income on health care; the figure for those over 75 or more is significantly larger. Given that health care is inflating at rates of 6% or more and given the likelihood that boomers will be consuming more health-care services, it's clear that advisors and their retiree clients need to spend considerable time and effort to plan for these critical expenses. In 2010, the other three big-ticket items for those over 65 were housing (35%), transportation (14%) and food (12%). These expenses total nearly 80% of all retirement spending, and a major portion of them should be considered as non-discretionary.
The High-Net-Worth Boomer Market: Product Shangri-la
The average income in 2010 for all Americans (using a 50-year-old boomer as a reference point) was about $62,500 gross and about $60,700 net of taxes. Approximately 70% of all households in the U.S. earn less than $70,000 per year. On the other end of the spectrum, only 7% of the U.S. population earns more than $150,000 per year. The middle-income groups (those with between $70,000 and $150,000 in income) account for the rest. It is hard for an advisor not to concentrate on the two top groups. But it's also obviously not fair if those in the lowest income categories cannot be served. Those clients need help too, and the commercial advisory companies serving them need to offer strict advice about discipline in their spending habits.
But let's examine the differences in spending habits between the middle class and the economic elite. Those in the high-net-worth group spend about 11% of their annual income on food while those in the middle-income group spend about 12%. Each group spends only about half these amounts for food they consume at home. Both groups spend about $32,000 on housing. Transportation accounts for about 16% of the middle-income group's expenses and 13% of the high-net-worth group's. Finally, the middle-class spend about 7% on health care while the wealthy spend 4.5%.
The middle class also spend proportionately more on each of these categories as their incomes decrease to $70,000 and the reverse when their incomes tend higher toward $150,000. The proportional spending patterns in different expense categories are fairly linear across all income groups. (The spending patterns of boomers and their retirement product needs will be discussed in a future column.)
In terms of personal savings, including retirement savings, the middle-class group saves about 17.5% while the high-net-worth group saves 21%. Finally, the wealthy pay an average tax rate of about 5.4% while their counterparts pay about 4%. Of course, it must be noted that the middle class have also saved more for retirement, and therefore their consumption pressures in retirement are expected to be somewhat lighter than those on the population at large. The high-net-worth group is generally adequately prepared for retirement. But the fact that they account for only 7% of the population is not very consoling.
Summing Up
The first thing to note is that the pending boomer crisis is real and immediate. There should be no illusions about this issue in the advisory community. The problem could be as big, if not bigger, than the 2008 financial crisis, which led to enormous bailouts. It's big enough that it could require the involvement of Congress and new legislation if boomers are to have enough money in retirement, including Social Security and Medicare. Unless such basic benefits are secured, the retirement problems of boomers will worsen. There are 90 million boomers retiring betweeen 2010 and 2030, and they collectively own most of the nation's assets. If they organized to fix this problem, they could become a huge political force of change. But in lieu of a grassroots movement, it is up to the advisory community to serve the children and grandchildren of those who fought World War II.
Somnath Basu is a professor of finance at California Lutheran University and the director of its California Institute of Finance. Dr. Basu also serves as a professor of the Helsinki School of Economics' executive MBA program. He's involved with financial planning organizations including the National Endowment for Financial Education, the CFP Board of Standards, the International CFP Board and the Financial Planning Association.