Many of us at Thornburg are baby boomers, and we are amazed by the disparity in the retirement income discussion within the financial advisor community. The discussion ranges from a simplistic comparison of product features to one that is academic and grounded in a holistic financial planning process. For those advisors who take a process approach to retirement income, there is a broad body of academic research regarding spending policies, tax planning techniques and evolving asset allocation strategies. The goal of this research is to enhance the client’s annual spending in retirement and the sustainability of the retirement portfolio for 30, 40 or possibly 50 years.
In our opinion, only a few of the retirement products now available have a place on the market. So many are overpriced or too complicated, and most require loss of control over assets. We know the so-called retirement-income product industry is bracing for a wave of capital from baby boomers, but we do not believe it will materialize because the products cost too much and investors are loath to lose control of their hard-earned assets. This reluctance will create an opportunity for knowledgeable financial advisors to assist baby boomer clients. During this pivotal stage of life, boomers’ accounts will need to be consolidated under one advisor to accommodate implementation and monitoring of a retirement-income process. To participate in this opportunity, advisors need to know about all the tools available to structure retirement portfolios and be committed to staying abreast of all the academic research that is being done in this area.
Building Sustainable Retirement Income Portfolios
In 1994, William P. Bengen, CFP, pioneered research into sustainable retirement income portfolios and establishing appropriate withdrawal rates when he published “Determining Withdrawal Rates Using Historical Data.” Using historical returns data, Bengen tested 50 different 30-year retirements that ran from 1926–1955, 1927–1956, 1928–1957, and so on up to 1975–2004. The analysis covered many business cycles and included four major bear markets. A major bear market was defined as one that lasted more than one year and consumed 50 percent of the retiree’s purchasing power after factoring in effects of both the S&P 500 Index decline and inflation. Needless to say, major bear markets have a devastating effect on any portfolio, but they especially impact those also undergoing withdrawal.
As a result of this research, Bengen is credited with establishing the 4 percent withdrawal rule (or “SAFEMAX,” to use Bengen’s vernacular), which states that for a retirement portfolio with a beginning value of $1 million, a retiree can spend $40,000, or 4 percent per year, and increase the annual spending amount by an annual cost-of-living adjustment. Bengen concluded that at this spending level, there was a 100 percent probability that the portfolio would last at least 30 years. Since then, Bengen has developed asset allocation models and withdrawal methods to find ways to increase the withdrawal rate without affecting the portfolio’s sustainability.
In 2006, Bengen wrote "Conserving Client Portfolios During Retirement" as a review of his research. The book also provides an eight-step process for developing a withdrawal rate and retirement-income portfolio tailored to a client’s needs. Bengen studied how various asset-allocation strategies affect both the withdrawal rate and sustainability of a retirement portfolio in distribution. For instance, he concluded that the optimal equity allocation was 60 percent, with the remaining 40 percent allocated to intermediate-term government bonds. He studied how the addition of small-cap stocks to a retirement portfolio could offer diversification benefits while allowing a retiree to increase the withdrawal rate or have greater confidence in the portfolio’s sustainability.
Many academic studies have sought to determine the benefits of allocating a portion of equity to various asset classes including small-cap, real estate investment trusts and international stocks. We found limited information, however, on how a high and growing dividend total-return strategy might benefit a retirement portfolio that is under the duress of withdrawal. While several academics have studied high and growing dividend strategies — most notably Jeremy Siegel at Wharton in his book Future For Investors — all these earlier studies proceeded from an accumulation perspective.
To advance this research, we analyzed a hypothetical retirement portfolio with an allocation to high-dividend paying stocks. We found that this focus on dividends had a significantly positive impact on both the portfolio’s withdrawal rate and its sustainability. While it would be optimal to spend merely the dividend income that a retirement portfolio provides and preserve the corpus for a legacy, this option is only practical for the wealthy minority. Most retirees will need to spend dividend cash flow and principal to sustain a retirement of 30 years or more. Regardless, we found that using a strategy focused on companies with high and growing dividends alleviates the stress of regular withdrawals and enhances the amount available for a legacy.
Dividend-Focused Strategy
Investors focus on total return when investing, not just capital appreciation or income. Although capital appreciation may at times provide the bulk of total returns, income has contributed its fair share as well. A broad equity index for all decades from 1871 to 2010 had an annualized total return of 8.8 percent over the entire period; the income component was 4.6 percent (52.3 percent of the total). The income component of total return was not only greater than the capital appreciation, but also significantly less volatile. The income component ranged from 6.4 percent to 1.9 percent, annualized over the 10-year periods. However, price appreciation was as high as 14.9 percent and as low as -2.8 percent. This wide range is unfavorable for investors when compared to the income component, which can never be negative.
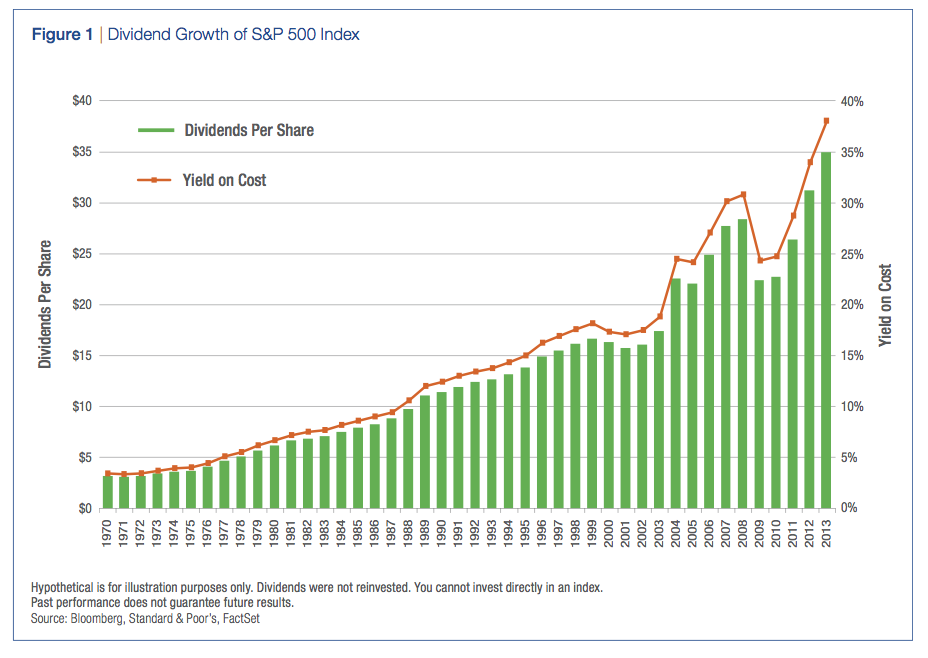
Figure 1 assumes if you bought one share of the S&P 500 Index on December 31, 1969, it would have cost you $92.06. In each subsequent year you chose to spend the dividends rather than reinvest them. In 1970, you would have received dividends totaling $3.14, for a 3.41 percent yield on cost; by 1980, your annual dividend would have increased to $6.16, for a 6.69 percent yield on cost; in 1990 you would have received $12.09, for a 13.13 percent yield on cost; and in 2011 you would have received $26.43, for an attractive 28.71 percent yield on cost. In fact, the average annual increase of the dividends over the entire 44-year period was 6.06 percent. This growth in dividend cash flow that occurred in the broad S&P 500 Index, with no dividend reinvestment, piqued our interest relative to its potential impact on a retirement portfolio in distribution.
We purchased a Standard and Poor’s database of monthly returns for the top 20 percent of dividend-paying companies in the S&P 500 Index (hereafter, the S&P Top 100 Dividend Payers). This database begins in 1968, is equally weighted, and provides returns through the present. Performing an initial comparison of the S&P Top 100 Dividend Payers to the S&P 500 Index reveals the characteristics shown in Table 1.
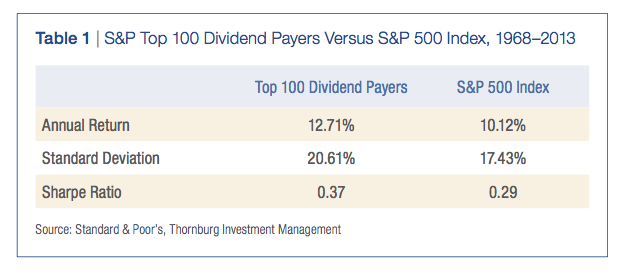
The S&P Top 100 Dividend Payers had a compounded annual return of 12.71 percent, 259 basis points higher than the S&P 500 Index. This increase, together with a small increase in the standard deviation, results in the Sharpe ratio — which measures the ratio of reward to risk for an investment — improving by 28 percent. Upon seeing these results, we reflected on Bengen’s book, in which he determined that applying an investment strategy with the ability to consistently provide superior risk-adjusted returns in excess of the index had a positive effect on the maximum withdrawal rate that could be used.
Effect Of Performance On Sustainability
Before we studied the impact that a high and growing dividend strategy would have on the withdrawal rate, we wanted to understand how the performance of the S&P Top 100 Dividend Payers would affect the sustainability of a retirement portfolio in distribution. Bengen graciously provided information that allowed us to replicate the work he had done, albeit much more simplistically, since we were trying to solve for only one factor to compare performance of the Top 100 Dividend Payers with performance of the entire S&P 500 Index. We constructed a model and assumed a $1 million investment in a portfolio allocated to 60 percent equities and 40 percent bonds, using the Barclays Intermediate Government Bond Index for the bond portion. For the equity portion, we used either the S&P 500 Index or the S&P Top 100 Dividend Payers. Monthly return data were used and both portfolios were rebalanced at the end of each year. In addition, we assumed a 5 percent spending rate: $50,000 was withdrawn at the beginning of year one of the retirement, then increased by a cost-of-living adjustment each year thereafter. These annual spending amounts were removed from the investment account at the start of each year and assumed to be placed in a checking account for spending purposes.
Given that the Barclays Intermediate Government Bond Index began in January 1973, we decided to test three time frames. First, we assumed a retirement that began on December 31, 1972, and lasted for the entire 42 years of available data. Next, we tested a retirement that began right before the 1987 bear market, assuming the retirement began on August 31, 1987, and has run for more than 26 years. Finally, we looked at the impact of the tech bubble and subsequent meltdown with a retirement that began in December 1999 and has run 14 years.
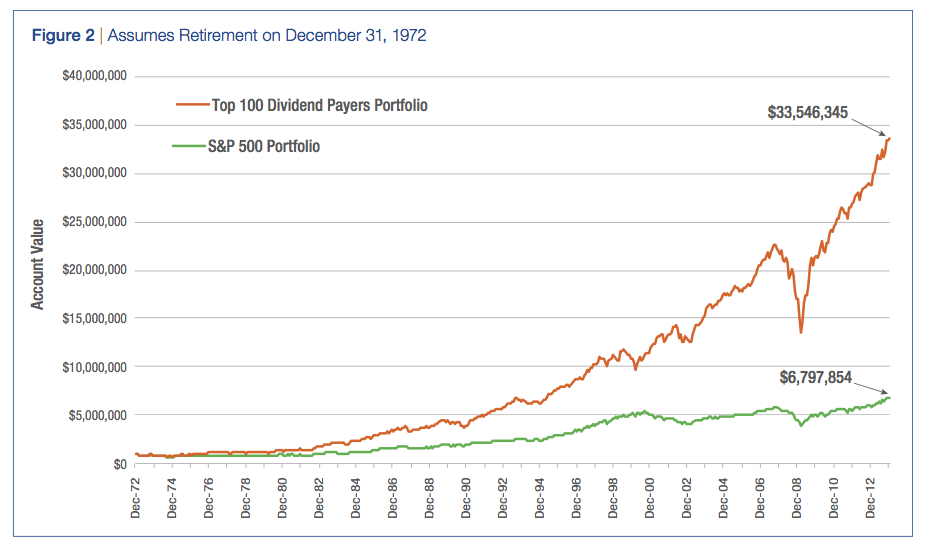
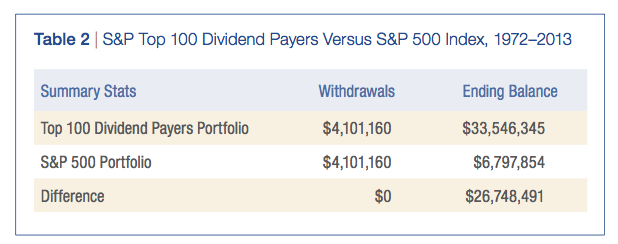
Scenario 1: December 31, 1972, to December 31, 2013
Figure 2 illustrates the ending account value for each year, assuming the retirement began on December 31, 1972. The Top 100 Dividend Payers portfolio far exceeded the performance of the S&P 500 portfolio. The withdrawal amounts under both scenarios are identical, but the corpus of the dividend-focused portfolio grew $26.7 million more than the S&P 500 Index portfolio. Table 2 shows the details.
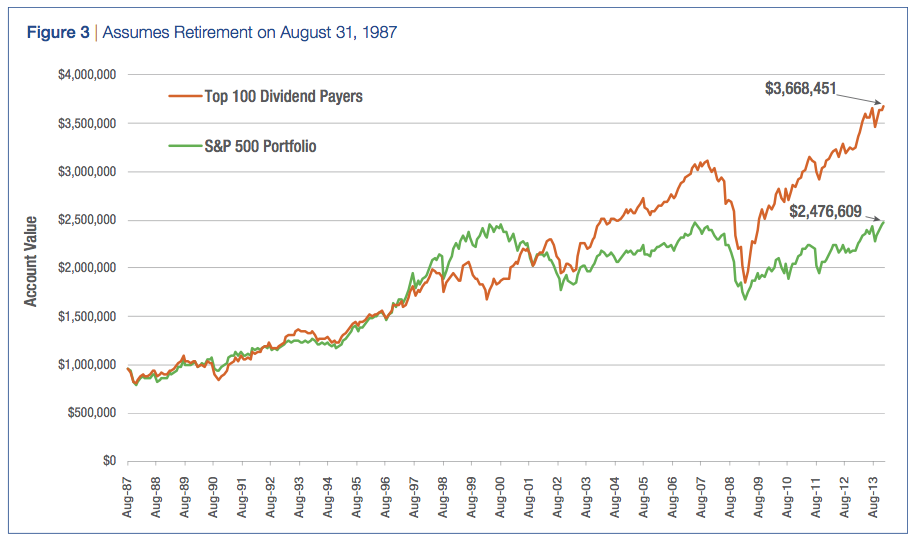
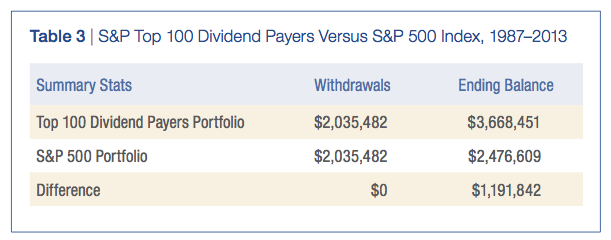
Scenario 2: August 31, 1987, to December 31, 2013
For the retirement that began just before the 1987 bear market, the dividend-focused stock portfolio again outperformed the S&P 500 Index portfolio (Figure 3). Note that the dividend-focused strategy lagged during the technology bubble from mid-1990 to 2001 but outperformed before and after that period. As shown in Table 3, the withdrawals were identical while the corpus for the dividend-focused portfolio exceeded the S&P 500 Index portfolio by $1,191,842.
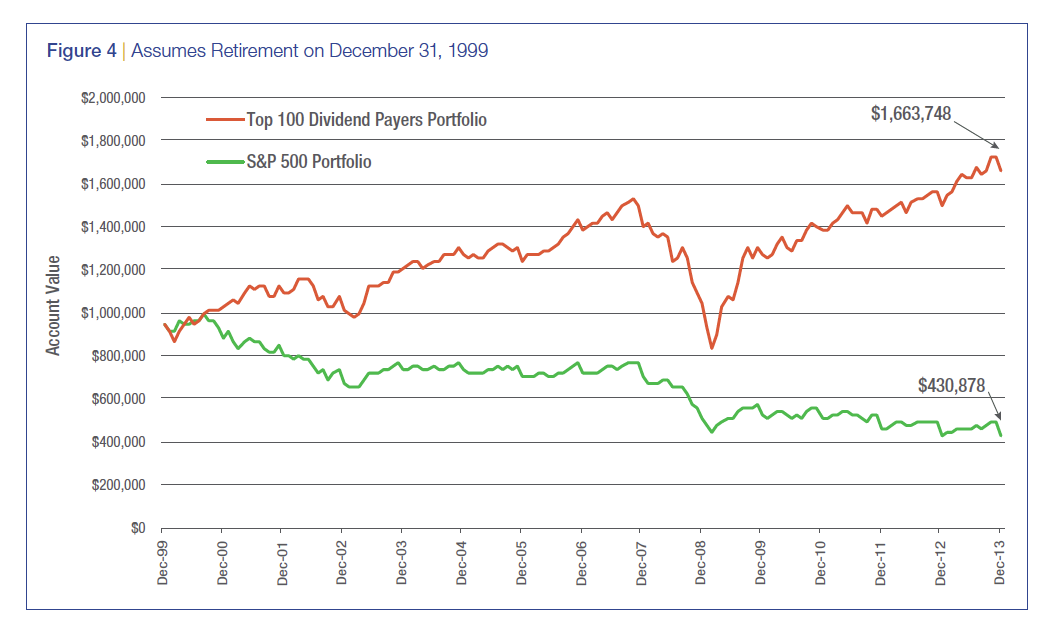
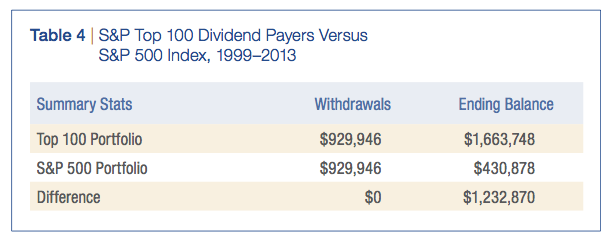
Scenario 3: December 31, 1999, to December 31, 2013
To illustrate a retirement that began just before the 2000 bear market, we began on December 31, 1999. Figure 4 illustrates that over a short 14-year time frame, the Top 100 Dividend Payers portfolio has been far superior to the S&P 500 Index portfolio. Given the drop in value of technology and growth stocks during this time frame, the outperformance of the dividend-focused approach was no real surprise, but the magnitude was a surprise. A retiree who began taking withdrawals from the dividend-focused portfolio at the start of the 2000 bear market was able to spend an equivalent amount and have a corpus more than three times as large versus the S&P 500 Index portfolio (see Table 4). Just think how fortunate this retiree was coming into the market tumult we have seen since 2008.
Impact on SAFEMAX
Having seen that the dividend-focused strategy improves the sustainability of a retirement portfolio in distribution, we wanted to determine how much the withdrawal rate could be increased without negatively affecting the portfolio’s sustainability. Given the multiple variables, we decided it best to pose this question to Bengen. He agreed to study the impact of the dividend strategy on his SAFEMAX, or maximum sustainable withdrawal rate. We provided Bengen with the S&P Top 100 Dividend Payers database of monthly returns, which he processed through his model.
Substituting Top 100 Dividend Payers for S&P 500 Index stocks had very beneficial effects on the SAFEMAX for retirees during the 1968–1975 periods. The SAFEMAX was increased by about 25 percent during this period, which translates into a significant improvement of lifestyle for those retirees. Investors in the 1956–1967 periods, who had “hybrid” equity allocations of the first 100 percent S&P 500 Index stocks, then Top 100 Dividend Payers beginning in 1968, also saw very substantial increases in their portfolio longevity.
Bengen’s conclusion focuses on the impact that a dividend-paying strategy had on retirees who began retirement between 1956 and 1967. This time frame is of particular interest given the devastating effects that the bear market of 1973–1974 and a concurrent period of high inflation had on retirement portfolios. To paraphrase, this 25 percent increase in the annual withdrawal rate allows the spending amount to be raised from $40,000 to $50,000 per year plus an annual cost-of-living adjustment. Therefore, the high and growing dividend strategy dramatically improves the quality of the client’s retirement years.
Key To Successful Implementation
Finding companies that have both the willingness and ability to increase their dividends over time is the key to successful implementation of this retirement income strategy. If you limit your universe solely to U.S. stocks, you will be focusing primarily on financial and utility companies for their higher dividend yields but may not end up with the desired growing dividend income stream. Looking outside the United States, you will find higher dividend-paying companies across almost all sectors as well as a greater inclination by company management to grow this dividend. This difference in dividend policy between domestic and foreign companies is cultural. In the United States, the primary measure of financial health is earnings, and chief executive officers are more inclined to re-invest the company’s capital on the next best idea in hope of attaining earnings growth. Companies outside the United States often are judged on their ability to pay a high and growing dividend, which is seen as a sign of financial health. In fact, looking at the market composites, estimated dividend yields averaged 2.1 percent in the United States, 3.7 percent in Europe, and 4.3 percent in the Pacific (excluding Japan). Although international investing comes with special risks, using a carefully selected portfolio of high-quality, global companies that pay a high and growing dividend can greatly benefit a retirement portfolio in distribution.
Conclusion
Financial advisors who view the retirement-income challenge as a process rather than a product will be successful gathering assets and consolidating accounts from our baby boomer brethren as we all move into retirement. This article shows that an allocation of a retirement portfolio’s equity to a high and growing dividend strategy can increase sustainability and improve retirement lifestyle via higher withdrawal rates.
Jan Holman, CIMA, CFP, AIF, is director of advisor education at Thornburg Investment Management.