Most arguments against socially-responsible and/or sustainable investing (SRI) are centered on the specter of lost opportunity. If one is limiting the opportunity set by removing securities from the investable universe, they are necessarily hampering returns-or so goes the story. If we examine this argument more closely, we recognize it as inadequate at best, flat-out wrong at worst.
The notion of a limited opportunity set in SRI holds validity at face value. SRI strategies most often incorporate negative screens, eliminating companies deriving more than 5% of their revenue from industries such as tobacco, alcohol, pornography, abortion and defense. Others may restrict investments in companies doing business with countries such as The Sudan or Iran. Those SRI strategies which integrate environmental, social and governance (ESG) concerns may introduce still more negative screens, avoiding investment in companies which score worst along those respective metrics. By definition, then, we see that the investable universe of an SRI practitioner is narrower than that of an "unconstrained" investment manager.
Let's turn back to the notion of an "investable" universe for a moment. We know the "market portfolio" is the true, unconstrained investable universe. This includes a representative percentage of all investable assets, including real estate, art, precious metals and stones, fixed income (government, municipal, corporate), and equities (public, private, international, domestic, emerging, large cap, small cap, growth, value) to name a few. By selecting the U.S. large-cap equity category for investment, one has already narrowed the investable universe tremendously. Second, nearly every U.S. large-cap manager uses screens in their investment process. These may used as risky top-down calls to avoid certain industries or sectors, to substantially raise cash levels due to a lack of perceived investment opportunities, or to eliminate low-priced, more illiquid securities or companies with negative earnings. The point here, then, is to acknowledge and understand that while SRI strategies do eliminate certain securities from the investable universe, this fact should not lead to the treatment Hester Prynne got in The Scarlet Letter.
There's also a general misunderstanding as to just how limiting the negative screens applied in SRI actually are. The concerned financial advisor should focus on two consequences of the screening process: the amount by which the investable universe is limited, and the impact of this limitation on the risk/return attributes of the new portfolio.
To illustrate these consequences, we created four scenarios:
the original S&P 500 Index
S&P 500 Index, with a socially responsible screen to eliminate companies deriving more than 5% of their revenue (directly or indirectly) from alcohol, gaming, tobacco, military and defense, or involvement with The Sudan (as measured by KLD Research & Analytics)
S&P 500 Index, with an ESG screen to eliminate companies ranking in the bottom 20% of their respective sector when measured against all U.S. companies along environmental, social and governance criteria (as measured by ASSET4)
S&P 500 Index, with a screen to eliminate the combination of the socially responsible and ESG screens described above
The analysis was repeated for each month from October 2004 through November 2009, with a monthly rebalancing of the S&P 500 Index.
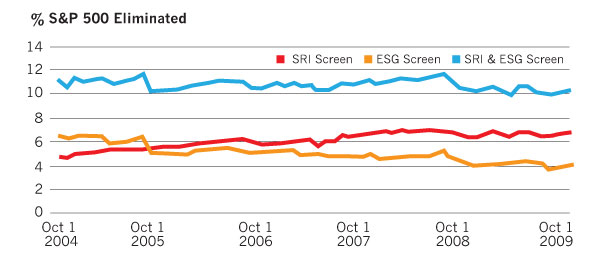
First, we examine the extent to which the three screens described above limit the investable universe:
The socially responsible screen eliminates an average of 6.09% of the S&P 500 Index's market cap.
The ESG screen eliminates an average of 5.02% of the S&P 500 Index's market cap.
The combined socially responsible and ESG screens eliminate an average of 10.78% of the S&P 500 Index's market-cap.
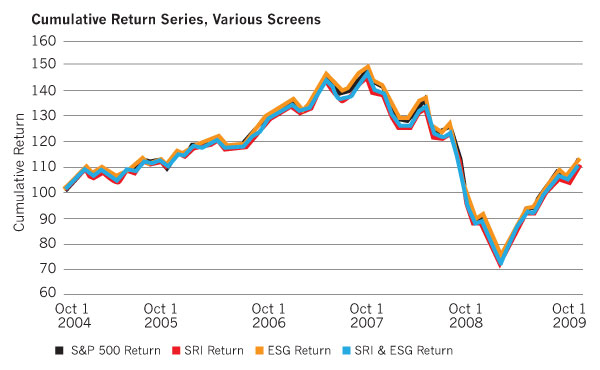
Next, we measured the impact of these negative screens on the risk/return profile of the investable universe:
The S&P 500 Index had an annual compound return of 2.04%, with an annualized standard deviation of 15.85%.
The S&P ex socially responsible-screened companies had an annual compound return of 1.61%, with an annualized standard deviation of 15.75%.
The S&P ex ESG-screened companies had an annual compound return of 2.13%, with an annualized standard deviation of 15.73%.
The S&P ex combined socially responsible and ESG screens had an annual compound return of 1.68%, with an annualized standard deviation of 15.65%.