


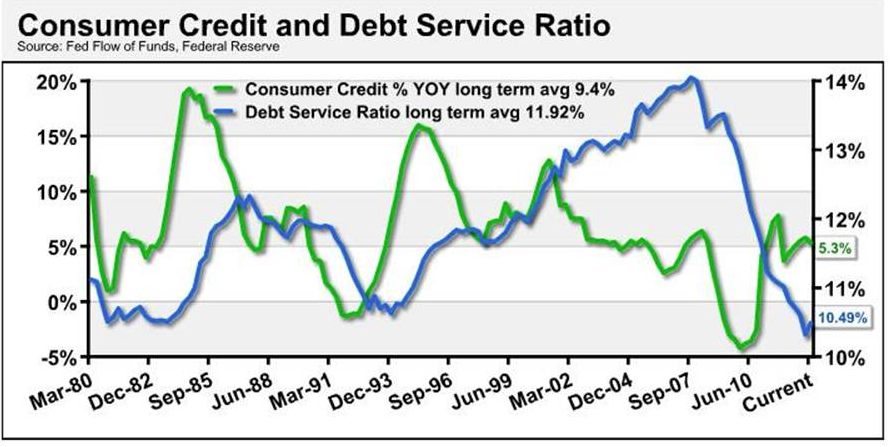
Debt service ratios for households stand near all-time historic lows after hitting all-time highs in 2007. The long-term debt services ratio has stood at 11.94 percent, with its current level at 10.49 percent. Consumer Credits’ growth is roughly 56 percent of its long-term average. With such a large amount of liquidity among household balance sheets, the access to credit looks to remain well below its long-term average for the foreseeable future. This conservative psyche driven by the credit crunch of 2008 has ultimately reduced the normal consumption expansion seen in past recoveries, but also positions the economy for some long-term growth at reasonable levels.
The spread is much wider during the long secular bull market in bonds versus the bear market prior to the bull market. The average spread between the Fed Funds effective rate and the 10-year Treasury rate during the bear market stood at 10 basis points while the secular bear market in bonds stood at 156 basis points.
Matt Lloyd is a Vice President and Chief Investment Strategist at Advisors Asset Management. His commentaries range from a macro look at the U.S. economy to expanding global markets. He analyzes key economic indicators to discuss these driving the industry and current market strategies.
Additionally, Lloyd writes an in-depth monthly publication, The Strategic Times and weekly economic update. He has made appearances on CNBC as well as on FOX Business News, and has been quoted in The Wall Street Journal and Investment News.  As more daily anxiety is driven by the interpretive actions of the Federal Reserve, we are reminded of an old joke. “How many Fed Chairmen does it take to screw in a light bulb? Only one, as he holds the bulb, the entire world revolves around him.” However, lost on the “he said, she said” moves about tapering or maintaining, lost is the actual impact the Fed has had on the economy in lieu of any congruent fiscal policy to compliment monetary policy. The baton is quietly being passed from recovery to expansion. Consider the progress made:
As the markets grapple with the Bernanke Put – meaning if economy slows down – the Fed remains accommodative and serves as a backstop to a slowdown. However, the real backstop is the immense amount of liquidity that remains in the system across the consumer, bank and corporate balance sheets. Perhaps the biggest backstop is what has happened with the debt service ratio for households and consumer credit growth.
With the highest amount of anxieties residing in the credit markets, in particular the U.S. Treasury yield curve, there appears to one consensus among 95 percent of both domestic and institutional investors: the secular bull market in bonds is now done. We agree with this assessment and have positioned portfolios for a rise in rates. However, the understanding of rate increases within economic cycles is crucial. The Federal Reserve is estimating their best guess for shifts in the Fed Funds rate is 2015. The U.S. Treasury curve, or market rates, typically moves eight to nine months prior to any shift in rates. However, due to the large degree of Quantitative Easing’s impact on the yield curve, the shift in the 10- and 30-year rates should be of no surprise as investors in these appear to be the most anxious of all investors. The Federal Reserve is projecting long-term Fed Funds rate to be right at the 4% level.
To better project where the 10-year Treasury might go in coordination with the rise in the Fed Funds rate, consider the following 50-year chart showing the spread between the Fed Funds Effective Rate with the 10-year Treasury yield. Once we break it off into two sections, the secular bull and secular bear, one gets a pretty revealing difference in the movement of market rates compared to the Fed Funds Rate.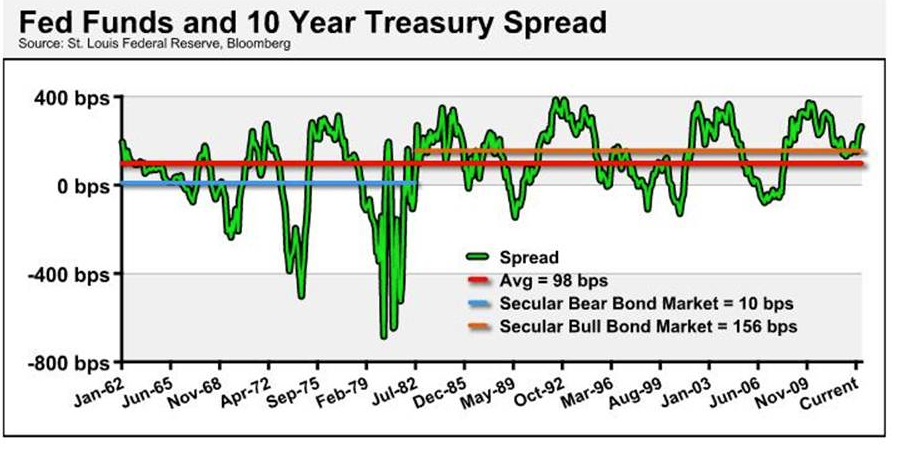
Considering it takes a secular market several decades to work itself out and the rise in the Fed Funds rate to the Fed’s estimated 4 percent rate during the next cycle could be estimated in a couple of years after the first move by the Fed, one can start to project where one should be invested in and why we believe utilizing the highest coupon available is the primary option of choice.
One other aspect that should also be in the forefront of fixed income investors’ minds is the relative nature of interest rate moves and its impact on economic growth. As an example, 30-year mortgage rates have risen to nearly 4.52 percent (according to Bankrate) from lows in the 3 percent range. Now a 4.5 percent 30-year mortgage rate is historically very attractive, yet at the current rate, we begin to see headlines of potential slowdowns in housing purchases and refinancing. This is in light that the 15-year average of the 30-year mortgage rate stands at 5.68 percent, and much higher the farther you go back. Yet we still see a bit of hesitation in this bump because the consumer is comparing it to the recent move. This is where the relative nature of comparing past results with future projections which often tethers a cyclical rise in interest rates. The relative nature is akin to a sprinter in the 100-yard dash. The athlete is always sprinting against the competitors, yet the speed of the track, the altitude and wind direction all play havoc with the times. The times are what we are trying to compare currently, even though they are hard to compare with the variables listed.
With rates rising, we are okay with a false start in getting prepared for it as the penalty seems far less than waiting too long; however, one must take the macro historical data points into consideration when looking at how long the next leg of the race actually is.
The Real Bernanke Put Is Already In Place, Regardless Of Tapering
July 16, 2013
« Previous Article
| Next Article »
Login in order to post a comment