


That scenario assumes a sub-2% Treasury rate and certainly were that to go even lower the resulting benefit to fixed income would be higher. On the other side, fixed income suffers its long expected negative return, dropping around 1.5% if faster wage growth and inflation fears lead to rising interest rates that erode the benefit of fixed income. That scenario presumes a slightly above 3% terminal 10-year rate (3.2%) and understates the potential losses were rates to rise beyond that.
So what scenario will it be? Today, we put about 10% odds on the inflation scenario, and 30% odds on the deflation scenario, leaving 60% for the baseline. But those baseline odds drop—and the deflation odds rise—for every continued drop in commodity prices.
Triple C: China, Commodity And Credit Fears – Idiosyncratic Or Systemic?
Fears over China, commodity prices and credit greeted the first week of the New Year. Becoming acute last August and resurfacing again in December, the nexus of China economic concerns manifest in a falling value of the renminbi vs. the dollar, falling oil and commodity prices expanding fears of credit defaults. Together these accounted for the negative returns in High Yield credit in 2015. In the aftermath, investors grapple with the key question: Are these issues isolated and idiosyncratic, or at least small enough to remain benign, or might they signal something more troublesome to the overall outlook?
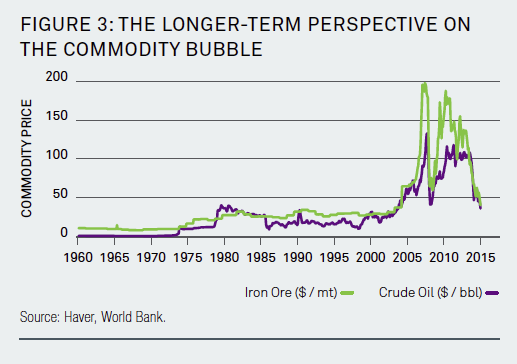
The answer depends on the consequences of the collapse of the China-growth-fueled commodity bubble. And while the debate rages on about just how, where and when commodities will find their “floor,” Figure 3 reminds us of just how extended that bubble was and how far its deflation has already come.
Not Falling Prices, But Falling Faith…
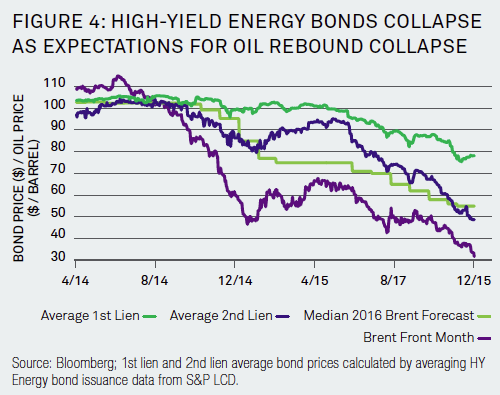
The most significant event of 2015 in our view is the collapse not in commodity prices themselves (for that had already happened in 2014), but rather the collapse in the belief in the recovery of commodity prices. At the beginning of 2015, the year-end 2016 oil price expectation held around $80 to $90, and today it stands at $55. As highlighted in Figure 4, the implication of undermining the belief in the recovery of oil is to introduce the realization of its consequence—default.
Figure 4 highlights the relationship between falling oil prices and falling prices of High Yield energy bonds (both first and second lien bonds). But unlike when oil first hit $50 back in December 2014, when it hit it again during the summer of 2015 expectations for future oil prices (in the figure indicated by the median year end 2016 Brent Forecast) collapsed. At the beginning of 2015, $50 spot oil was still associated with expectations for a rebound to $85. When oil hit $50 again in the summer of 2015, expectations for rebound collapsed.
…Broaden The Impact Of Collapsing Commodities
And it was the collapse in these longer-run commodity price recovery expectations that were associated with the broadening of commodity concerns outside of the relatively small independent energy production sector of U.S. High Yield. The 20 point declines that occurred in September 2015 in the bonds of Petrobras, Glencore, Anglo American and Freeport- McMoRan are not the small, independent energy producers that dominated the declines in High Yield, but large, global and currently (or formerly) investment grade-rated names held broadly in investor portfolios. The significance of this shift is illustrated by the fact that investor losses in 2015 on these four names alone stand just under the entirety of losses borne by investors in the entire high yield energy sector.
Denial highlights why financial markets did not immediately in 2014 or in the beginning of 2015 price in the significance of such a substantial collapse in commodity prices. If “home prices can only go up” was the slogan of our last bubble, “commodity prices can only stay up” was the slogan of our latest. As that bubble of beliefs bursts, creditors cut exposures and issuers unable to service debts with falling revenues are now unable to delay that service with debt rollovers. So fears of default in 2014 turned to realization with a quadrupling of defaults in commodity sectors in 2015.
The Oil Spill (Over): The Case For Systemic
Which brings us back to our original question: What are the signals from the credit markets telling us? Here, we make the case for the systemic risk possibilities. As such, this represents the risk to the more benign outlook. Stabilization of commodity prices should limit this risk scenario, but as long as the outlook for commodity prices remains uncertain, the greater the potential systemic spillover effects.