


Ignorance Breeds Confidence; Knowledge Breeds Doubt
Next, “failure of imagination bias” reinforces the anchored view to 2% default rates drawing even more investment into the sector. This bias means most investors never spot what ultimately causes the credit cycle to turn. The shift is always a surprise. The consensus never saw the internet collapse. The consensus never saw the housing collapse. And the consensus never saw the commodity collapse.
Fear Trumps Greed
Finally, with the collapse now revealing to these investors the faults of their first two fundamental cognitive biases, loss aversion—the preference to avoid losses over making gains— kicks in. This one stems from the belated realization that historically, two-thirds of all default realization over a typical 7- to 8-year credit cycle occurs in only 3 of those years—the peak and the years surrounding it. The realization that the peak of credit losses is now just around the corner leads investors (particularly those whose participation came late in the credit cycle, revealing a preference for lower risk investing) to do what can be seen in this light as an entirely rational decision: in order to avoid those future defaults and losses, they sell. And in so doing they provide the very catalyst necessary to create the credit cycle they fear—the withdrawal of liquidity. And so begins the vicious part of the credit cycle: falling liquidity leads to fears of default which leads to a further withdrawal of liquidity.
Cognitive Bias Combines With The Supply Side “Minsky” Cycle
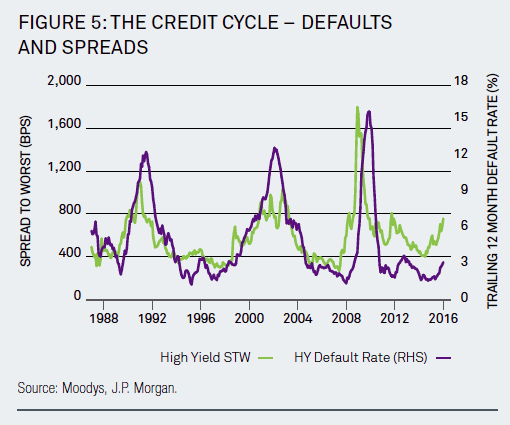
The above characterizes the behavioral underpinnings of the demand side of the credit cycle. That combines with the more familiar underpinnings of supply known as the “Minsky” theory of the credit cycle and its three stages—hedge, speculative and Ponzi. The combination of both supply- and demand-side behavioral factors creates the credit cycle history of peak to trough defaults depicted in Figure 5.
But How Much Is Already In The Price?
Despite such concerns, however, clearly the market reflects some of those concerns. As a result we upgraded late last year our underweight stance on High Yield to neutral, reflecting this better balance between risk and reward. We anticipate another tactical allocation strategy for High Yield (and relatedly other higher credit risk segments of the market) for 2016. But the commodity price bust has clearly ushered in the next credit cycle, making the outlook for returns more challenging and arguing for neutral to underweight allocations rather than the overweight allocations we had favored when the credit cycle was not as long in the tooth.
The Credit Cycle Leads The Business Cycle
A key lesson from the last crisis was that asset price bubbles bursting can create recessions. The collapse in the credit market for housing-related credits cascaded risks into the financial system, threatened its collapse and caused a credit crunch that led to the Great Recession.
Today, the risks posed by China, commodities and credit appear not to rise to the level of the 2008 global financial crisis. That level of virulence stemmed from hitting both the heart of the economy (the consumer) and the heart of the financial system at the same time.
Rather than “Great” we see more a “garden variety” type of credit cycle. But even garden variety credit cycles can lead to business cycle recessions and significant implications for financial markets. And conventional wisdom misses the fact that credit cycles do not follow the business cycle, they lead.
Former Fed Governor Jeremy Stein recently highlighted the economic and credit market evidence supportive of these views long held by many participants in credit markets. This work reminds us that though the global financial crisis is the most recent and perhaps strongest example since the Depression, it is by far not the only example of credit markets leading the business cycle. For virtually every business cycle finds its spark in a credit cycle. The specific manifestation may differ, and certainly as our credit intermediation has moved from bank to capital markets (with the 2008 crisis the capstone in this transition), the form has evolved. But the causality is clear and its consequences profound: if you are looking for signs of the next credit cycle in today’s economic data you have got your model backwards.
Figure 6 above highlights the main conclusion exhibit of Stein’s paper. Here the authors looked at credit market indicators—summarized as “credit-market sentiment”— compared to business cycles since 1920.
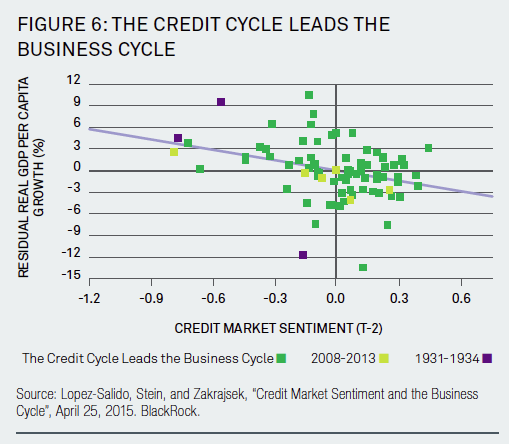
The x axis highlights “credit market sentiment,” a measurement of conditions in the credit markets, lagged by two years. Positive values reflect ample access to credit and low relative costs of credit. The y axis shows the business cycle condition. Importantly, the authors find that credit market sentiment today is related to business cycle outcomes two years hence. Now note the inverse relationship. This highlights that today’s boom in credit is followed by economic bust two years later. And considering that the peak of “credit-market sentiment” appears to have occurred in 2014, it suggests by this crude historical analogy an economic downturn in 2016.