KEY TAKEAWAYS
· We continue to expect an improving economic backdrop in the second half and a stock market with the potential for more new highs before year-end.
· However, growing near-term concerns are making the odds of some type of a late summer correction more likely.
The S&P 500 gained 3.6% during the historically bullish month of July 2016, closing higher for the fifth consecutive month for the first time in two years. It also soared to new all-time highs for the first time since May 21, 2015. As discussed in our Weekly Market Commentary, “Overcoming a Wall of Worries” (June 20, 2016), the list of worries had been long, but we thought an improving economic backdrop coupled with strong market breadth and a very pessimistic sentiment backdrop should help the market resolve higher, which fortunately happened.
Now the big question is, can this strength continue and the S&P 500 close higher in August to make it six straight months of gains? Although we continue to expect an improving economic backdrop in the second half of the year and a stock market with the potential to make more new highs before the year is over, there are some growing near-term concerns — making the odds of some type of a late summer correction more likely. The good news is we do think this weakness will be an opportunity to add to equity exposure and higher prices could still come later this year.
Here are four growing concerns:
#1: SEASONALITY
The good news is July seasonality (on average the strongest summer month) worked perfectly this year. The bad news is after the S&P 500 gains more than 3% in July (like it did in 2016), August has been lower four of five times going back 20 years, with an average decline of 2.3%. Also, as we mentioned on the LPL Research blog last week, the S&P 500 is in one of the its tightest ranges ever. In fact, using daily closing prices it was recently in the tightest 11-day range since August 1995. In other words, the odds that this tight range changes into rising volatility are very high this August.
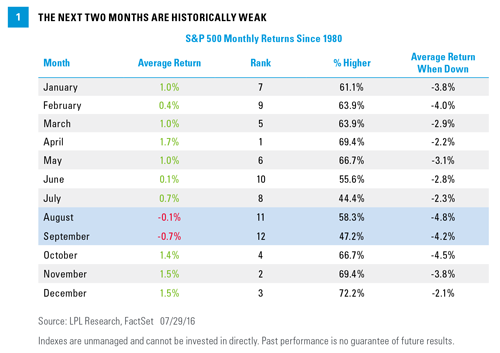
More bad news is that August and September are historically two of the weakest months of the year for the S&P 500. Going back to 1980, they are the only two months to have a negative average return [Figure 1]. Looking specifically at August, on a price return basis it returns -4.8% on average when it is negative, the largest drop for any month of the year. In other words, when August is down, it is really down. For example, it lost 6.3% last year on the surprise China yuan devaluation, lost 5.7% in 2011 on the U.S. debt downgrade, 14.6% in 1998 thanks to the Russian financial crisis, and 9.4% in 1990 after Iraq invaded Kuwait.
Why do these unknown events seem to take place in August? It could be simply random, or maybe the effects of big news is amplified in the summer when trading is light and many are taking summer vacations. This doesn’t mean we will have another unforeseen market shock this month (we would tell you if we knew!), but be aware it wouldn’t be out of the question either.
#2: DERIVATIVES POSITIONING
With the S&P 500 making new highs, we are seeing a significant change in overall investor sentiment. As we noted in our Weekly Market Commentary from late January 2016, “Any Bulls Left?”, many sentiment polls and indicators had been flashing extreme fear consistent with major lows. Now after more than a 20% rally from those February 2016 lows, sentiment is beginning to turn much more optimistic, potentially a warning sign.
Recently, positioning in the derivatives markets has become much more bullish, according to data from the Chicago Board Options Exchange (CBOE). In fact, last week, the 21-day moving average of bearish equity derivatives relative to bullish equity derivatives was the most bullish this group has been in over a year. From a contrarian point of view, this many bulls showing up at new highs could be meaningful.
#3: SENTIMENT POLLS ARE MUCH MORE BULLISH
Active money managers are the most exposed to U.S. equities they have been since November 2013. In fact, the National Association of Active Investment Managers (NAAIM) Exposure Index jumped above 100 last week for only the fifth time in the 10 year existence of the weekly survey. For reference, this survey was 22 in early February 2016 [Figure 2].
Not surprisingly, the other moves above 100 happened with the S&P 500 near all-time highs. The good news is the S&P 500 has been higher six months later all five times with an average return of 7.9%, so this doesn’t appear to be a major contrarian warning.
Adding to the bullish sentiment backdrop, the Investors Intelligence U.S. Advisors’ Sentiment Report has 54% bulls, the most since May 2015—although it isn’t quite at the historically worrisome level of 60%. Lastly, the Citigroup Panic/Euphoria Model is at its highest level in a year, again suggesting more positive sentiment for equities. The good news is this still isn’t near “euphoric” levels, but it is still high relative to recent readings.
#4: HUGE INFLOWS INTO THE SPDR S&P 500 ETF Trust

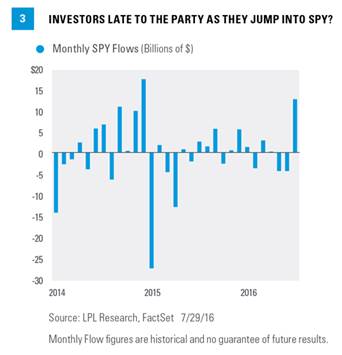
Looking at Bloomberg data, we’ve noted before the huge outflows from equity mutual funds and that trend continues with no end in sight. The majority of those funds have found their way either to bond mutual funds or exchange-traded funds (ETF), or stock ETFs. But the S&P 500 making seven new highs last month has sparked a huge surge back into the SPDR S&P 500 ETF Trust (SPY). For the month of July 2016, this ETF saw inflows of $13.3 billion, the third most since 2011, and the most since $17.8 billion in December 2014 [Figure 3].
Is this a “late to the party” surge, or could it just be the beginning of money moving out of bond funds and ETFs and into stock funds and ETFs? We’ll call it more a near-term worry than anything, as flows into equity funds and ETFs are still nowhere near past major peaks. But the sudden surge does add to the potential for a near-term shake out.
Why Any Pullbacks Will Likely Be Contained
As the risk of increased market volatility becomes higher in August due to seasonal price patterns and increasing bullish sentiment, one saving grace may be the recent improving trend in equity market breadth (as measured by the percent of S&P 500 members with new 52-week highs), which may lessen the impact of a potential equities market sell-off.
We first introduced this market breadth indicator in a blog post entitled “Bullish Market Breadth: Better Late to the Party Than Not Show Up at All” (June 9, 2016). Since then, the three-week average of the percent of S&P 500 members with new 52-week highs has remained above the 6% threshold (currently at 7.1%), which increases the likelihood that this breadth indicator is supporting the beginning stages of a bullish cycle or trend [Figure 4].
Looking at historical weekly data, when the three-week average of the percent of S&P 500 members with new 52-week highs is above 6%, subsequent returns on the index tend to be bullish. Going back to 1990, there were 57 times this happened. Three months later, the S&P 500 was higher 38 times (67% of the time) with an average return of 1.1% and a median return of 2.4%. Going out six months, the returns are higher 46 times (80% of the time) with an average return of 4.2% and a median return of 5.1%. Looking out over 12 months, the returns were higher 51 times (89% of the time) with an average return of 9.9% and a median return of 9.7%.

With the percent of S&P 500 members with new 52-week highs remaining at levels that support the continuation of a bullish price trend for stocks, we view any potential short-term weakness in the equities market as an opportunity to buy on a dip.
CONCLUSION
Seasonality, sentiment, and the coming election could all add to potential volatility over the next few months. From a bigger picture perspective, it is comforting that many sentiment indicators are nowhere near levels seen at past major peaks. Yes, near-term the concerns have greatly increased, as there are many more bulls now, but we don’t see any signs from sentiment readings that would lead us to think the bull market is near an end.
We still expect a better economy in the second half of the year, which we believe may result in total equity returns potentially in the mid- to high-single digits when 2016 is all said and done.* This, along with support from breadth and minimal pressure from improving sentiment, may limit any potential pullback to 5-10%. But put your seatbelts on, as August may provide for a lot more volatility than the second half of July did.
*We expect mid-single-digit returns for the S&P 500 in 2016, consistent with historical mid-to-late economic cycle performance. We expect those gains to be derived from mid- to high-single-digit earnings growth over the second half of 2016, supported by steady U.S. economic growth and stability in oil prices and the U.S. dollar. A slight increase in price-to-earnings ratios (PE) above 16.6 is possible as market participants gain greater clarity on the U.S. election and the U.K.’s relationship with Europe.
Burt White is chief investment officer for LPL Financial.