


“The presidential choice is either Hillary Clinton or Donald Trump – and voters everywhere are asking: is there any other option? We were at a conference this week with over 200 savvy investors who favored ‘none of the above.’ Clinton and Trump had virtually no support with this group, and everyone asked us – is there another choice? There are only four options.”
After listing the four longshots Valliere concludes:
“Sorry, there's virtually no chance that there will be any last-minute surprises. It's the very slippery Hillary Clinton versus the cringe-inducing Trump, with a few fringe candidates lurking. When we tell this to clients and friends, many vow to write in themselves or relatives.”
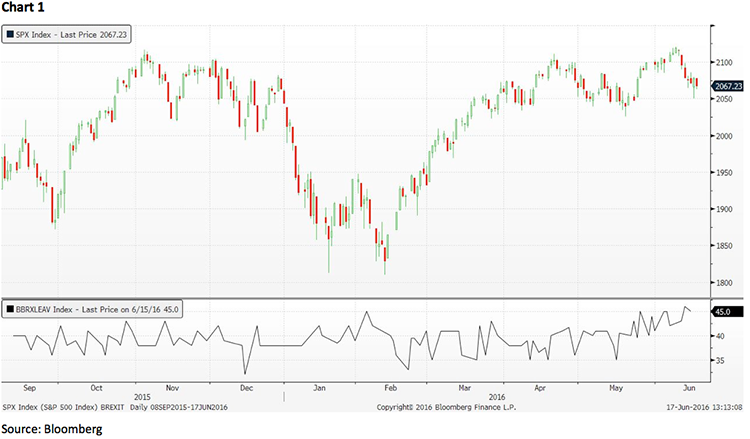
Now, while there is not much R2 between our presidential election and the stock market, I did have one portfolio manager ask, “Do you think the rally off of the February low into the June high had anything to do with Trump’s rising popularity?” After I got done laughing I responded with a resounding, “No.” However, I must admit as Trump’s faux pas increased the S&P 500 (2071.22) fell some 3.3% into last week’s intraday low of 2050.37, which is the upper-end of the S&P’s 2040 – 2050 support zone. Given the manic depressive mood of Mr. Market I thought it best to “Better Call Saul.” Yet in this case it was not the TV series, but “Better Call Shad,” namely Frederick “Shad” Rowe, captain of the brainy Dallas-based Greenbrier Partners. I first encountered Shad in the 1970s when he was managing money and writing a column for Forbes magazine. His writing skills, and his investment acumen, are legendary. Coincidentally, Shad had written a column for Barron’s last week titled, “Pension-Fund Investing for Success” (Article), with the tag line, “Never mind the consultants, buy US stocks for the long term.” Some of the highlights from said article are:
1. Have you noticed that since the stock market selloff in 2008, these folks (the consultants) have consistently advised clients that they reduce exposure to U.S. stocks? Their advice has been consistently wrong, as the tough-to-beat Standard & Poor’s 500 hit new highs last year.
2. Pension consultants’ advice has contributed mightily to the insolvency of cities, states, municipalities, and corporations unable to meet their pension obligations because of poor investment returns on their pension funds.
3. Let’s consider pension funds, looking at each 20-year period – roughly the typical career length of a policeman or fireman – on a rolling basis over the past 50 years. That is, we’ll look at 20 years, starting in 1965, then 20 years starting in 1966, and so on. Returns on investment in the S&P 500 stock index for each period have fluctuated between 8% and 12%. Each period contained some bad years, but there were always more good years and they outweighed the bad results for every 20-year stretch.
4. While the actuarially assumed rate of return for most public pension systems is approximately 7.5%, the stock market has managed to climb the proverbial wall of worry and offer superior returns, compared to virtually all available alternatives – if you stayed fully invested in the index for the full 20 years.
5. Here is a prediction. A gigantic market move to the upside is coming, as investment committees assess their costs and reach the conclusion that the stock market is their best and only hope to meet their obligations.
So despite Shad’s sage advice, the bears are convinced we are in a trading range environment at best, or a major stock market top at worse. Most of their arguments rest on valuations and a lack of earnings growth. Looking at valuations, the only metric that looks overvalued to me is Shiller’s Cyclical Adjusted Price Earnings model (CAPE), which at 26.1x earnings is about 10 points over its long-term average. Most of the other valuation tools are either marginally overvalued, or below their long-term average. Indeed, the trailing normalized P/E ratio for the S&P 500 is at 18.0x versus its average of 19.0x, while the price to free cash flow is at 23.0x versus its average of 28.1x. As for earnings, while it’s true earnings have had negative comparisons since late 2014, revisions to earnings growth estimates has been improving for nearly four months. Manifestly, the positive to negative earnings estimate revisions (EER) is now at nearly a two-year high from its long-term average. Hence, the earnings worm seems to have turned.
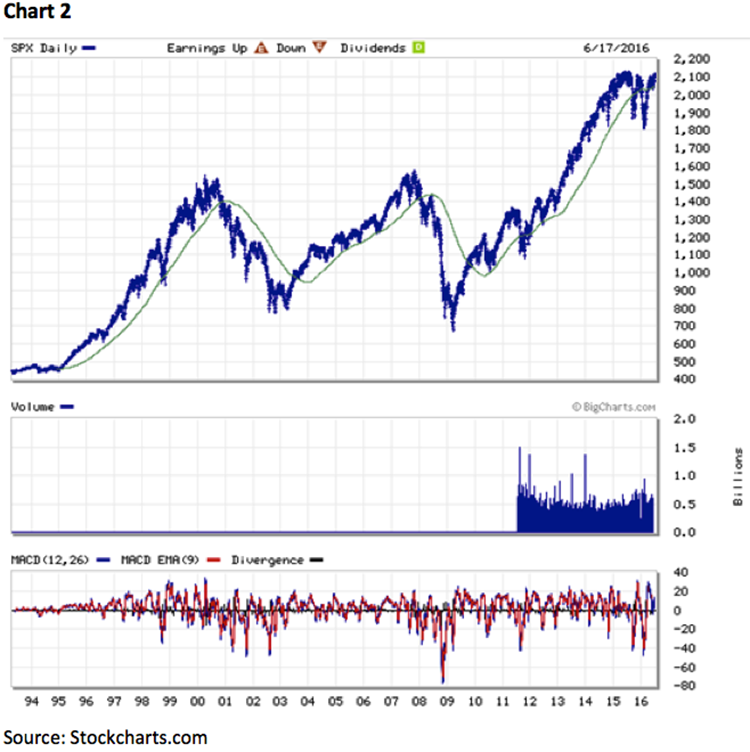
From a technical standpoint, the SPX has tended to be okay when it has traded above its 20-month moving average (MMA). Over the past 15+ years it has decisively fallen below that MMA, and failed to recapture it quickly, twice, as can be seen in chart 2 on the next page. That happened in early 2000, and again in late 2008, with devastating results. Currently, the 20-month moving average around 2040 for the SPX, which is one of the reasons the 2040 – 2050 support zone is pretty important.
The call for this week: Last week we mentioned a few times that the British Brexit reminds us of previous non-events like the 2014 Scottish vote, the Greece gotcha, the Italian mob job, Y2K, etc. We expect the UK to stay in the EU, which should produce a Brexit Bounce for the world’s equity markets. As for sectors, last week the only major sector that was up was the Utility sector (+0.88%), which rallied out to new all-time highs, but that paled in comparison to the rally in natural gas of more than 7%. Speaking to the other macro sectors, Consumer Discretionary is on support; the Consumer Staples sector is extended; Energy is on support; Financials, Healthcare, Industrials, and Information Technology are all neutrally configured in the short-term; Materials, Telecom, and the Utility sectors are overbought. This morning, however, stocks soar as British Brexit worries ebb with the preopening S&P futures better by 27 points at 6:00 a.m.
Jeffrey D. Saut is chief investment strategist at Raymond James.