As we enter March, market participants are already looking ahead to the Federal Reserve’s (Fed) next Federal Open Market Committee (FOMC) meeting. While the meeting isn’t until March 15–16, 2016, markets are already trying to decipher how the widening disconnect between what the Fed plans to do with the fed funds rate and what the market thinks the Fed will do will be resolved. Part of the problem is timing. The latest set of “dot plots”—where each of the 19 FOMC members think the fed funds rate will be at the end of 2016, 2017, 2018, and beyond—is nearly three months old, having been released at the conclusion of the December 15–16, 2015 meeting. The December 2015 dot plots show that the Fed plans to raise rates by 100 basis points (1%) this year (or four 25 basis point hikes). The market, as measured by the fed funds futures market, doesn’t think the Fed will raise rates again until late 2017. Yes, you read that correctly, late 2017, nearly two years from now [Figure 1].
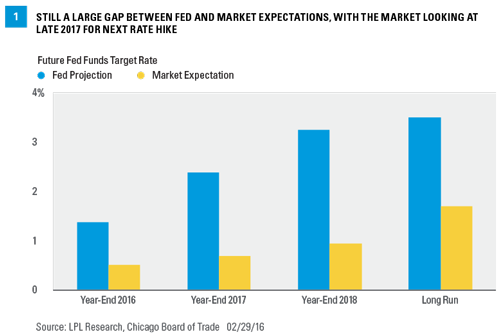
Based on recent comments from Fed officials and the Fed’s relatively high tolerance for financial market volatility, our view is that the March 2016 update of the FOMC dot plots may show that the Fed plans to raise rates by at least 50 (and perhaps even 75) basis points this year. Although this adjustment would help to narrow the disconnect between the FOMC and the market somewhat, it is nowhere near closing the gap completely. So, why the disconnect? March madness, perhaps?
Inflation Disconnect
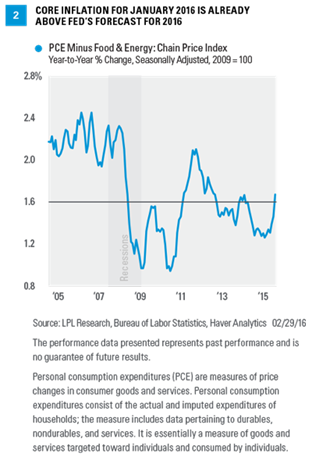
Although many reasons for the gap exist—slower than expected economic growth and heightened risk of recession here and abroad, tightening financial conditions, volatile financial markets, a stronger U.S. dollar—one of the key reasons is the difference between the market’s view of future inflation and the Fed’s view. Here again, timing is an issue, as the Fed’s view of inflation excluding food and energy (core inflation) over the next few years (1.6% in 2016, 1.9% in 2017, and 2.0% in 2018) is three months old. For reference, the year-over-year reading on core inflation in January 2016 (released on Friday, February 26, 2016) was 1.7%, above the Fed’s forecast for 2016 [Figure 2]. Want even more madness?
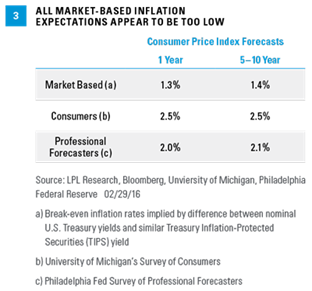
A recent study by researchers at the St. Louis Fed suggests that for the inflation forecast imbedded into the Treasury bond market to be correct, the price of a barrel of oil would have to fall to zero (yes, zero) by 2019. Although this example is admittedly extreme, market-based inflation expectations, and inflation expectations of individuals and professional forecasters, all appear to be too low [Figure 3].
Goods Versus Services
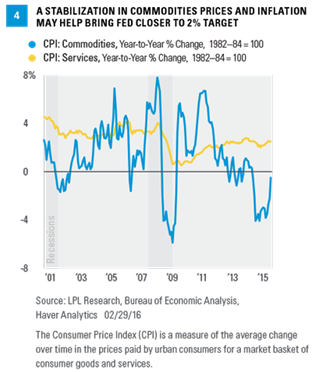
As we noted in our Outlook 2016: Embrace the Routine publication, inflation remains in check, but commodity/goods inflation may be poised to make a comeback, which would help keep the Fed on schedule to continue raising rates. Since the middle of 2009, prices of services in the economy (as measured by the Consumer Price Index [CPI] for services) accelerated from under 1.0% to as high as 2.8% in early 2014, and then settled into a range of 2–2.5%. Prices of services (medical services, rents, etc.) account for over two-thirds of overall CPI. History suggests that as the business cycle ages, and as the housing and labor markets tighten, service inflation may continue to accelerate. In January 2016, this measure of CPI inflation was up 2.5% from January 2015.
On the other hand, the CPI for goods (prices of oil and other commodities purchased by consumers, which accounts for only one-third of overall CPI) sank along with oil prices from mid-2014 through early 2016. This kept the U.S. economy flirting with deflation (a prolonged period of falling wages and prices). Overall CPI posted a 2.1% year-over-year gain in mid-2014, but by January 2016 the overall CPI was just 1.4%, after dipping as low as -0.2% in mid-2015. Looking ahead to the remainder of 2016, if oil prices move up as we expect, the goods portion of CPI may increase by 2–3%; and if the pace of service sector inflation remains between 2% and 2.5%, overall CPI could accelerate quickly and may be well over 2.0% by year-end. By then, the Fed may have already raised rates again [Figure 4].
Week Ahead
Although market participants are already looking ahead to the upcoming March FOMC meeting, U.S. economic data (February reports on jobs, Institute for Supply Management [ISM] manufacturing and non-manufacturing, and vehicle sales), along with the Fed’s latest Beige Book (a qualitative assessment of economic conditions in each of the 12 Fed districts around the country) gives the market much to interpret this week as it waits for the Fed. In addition, appearances from New York Fed President Bill Dudley and San Francisco Fed President John Williams, both policy doves and voting members of the FOMC, and Dallas Fed President Robert Kaplan, a policy hawk, will provide plenty of fodder for market discussion.
While this week’s full slate of economic data for February will likely garner attention from market participants as they try to gauge the Fed’s next move, the market should probably continue to keep an eye on commodity prices as well, because a stabilization in prices near today’s levels may be just enough for the Fed to hit its inflation target for 2016.
John Canally is chief economic strategist for LPL Financial.