


2016. Keeping an eye on market-determined commodity prices, especially for those used in production like copper and oil or infrastructure like iron and steel, may offer a signal on the pace of growth in China.
Producer prices pointing to stabilization in China’s economy in the first quarter
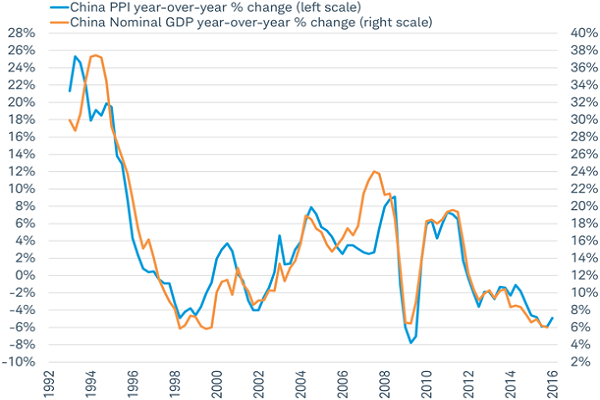
Source: Charles Schwab, Bloomberg data as of 3/4/2016.
3) Baidu SME Index
The official data on retail sales in China shows a relatively stable trend of double-digit growth over the past year. An alternative to these official figures, the Baidu SME index, has been telling a different story. This index is based on internet searches on China’s dominant search engine for the products and services of small- and medium-sized enterprises (SMEs). Readings below 100 signal deterioration. This index fell to 98.9 in February suggesting demand for SMEs' products and services may be reversing the rebound seen in the second half of 2015. As consumers and small businesses have become powerful forces in China; a further slowdown in this index would suggest policies to support growth may be failing.
Internet product searches in China maybe rolling over after rebound in late 2015
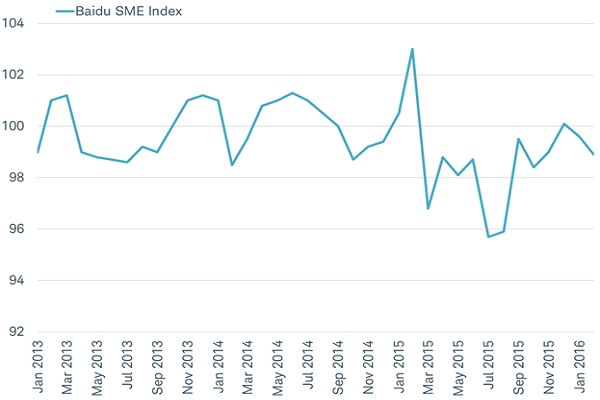
Source: Charles Schwab, Baidu data as of 3/6/2016.
4) Tsinghua UnionPay Advisors Real Estate Index
China’s real estate market has been a source of concern for investors after property prices began to fall in 2014. However, a recovery unfolded in 2015 and appears to be gaining momentum according to official data from the China’s National Bureau of Statistics. A privately produced measure of the volume of housing transactions known as the Tsinghua UnionPay Advisors Real Estate Index can offer us impartial insight into the pace of housing activity in China. This index measured 18% year-over-year growth in Chinese property purchases in January as lending surged. Readings in the months ahead may be a useful gauge of the success of new policies, like a reduction in down payments and lending rates, intended to support housing.
5) Asian exports
China is Australia’s largest customer, being the destination for more of Australia’s exports than Japan, the United States, and Korea combined. For January, Australia’s exports were down -6.7% from a year ago, but posted a 1% gain for the month—the first monthly gain in exports in four months. South Korean exports may also provide a useful gauge of China’s growth since mainland China makes up 25% of Korean exports. Like Australia, Korean exports has been weak lately, but the year-over-year pace of exports to China eased in February to -16.0% from -21.6% in January. Unlike the other four indicators, this Asian export data isn’t complied by a private-sector source. But since it comes from the Australian Board of Statistics and Korean Ministry of Trade, Industry and Energy and not from the Chinese government, it is less likely to be biased in its take on China’s demand growth.
Trust but verify
“Trust, but verify” is always a good approach for investors. These five monthly independent measures of China’s economy may help to confirm or refute the trends in the data produced by the Chinese government and offer insight into the sustainability of the rebound in the markets. If the Chinese economy appears to be slowing, but not crashing, markets participants may be relieved. On the other hand, widespread weakness in the independently produced data may lead to the return of selling by global investors.
Jeffrey Kleintop is senior vice president and chief global investment strategist at Charles Schwab & Co.
Read more here.