


Key Points
• China’s government has signaled increased support for the economy, prompting the return of some optimism by market participants.
• China’s official economic data may just say what the officials want it to.
• We provide five indicators that may provide independent insight into whether the Chinese government’s efforts to support growth are succeeding: Caixin China Purchasing Managers Index, commodity prices, Baidu SME Index, Tsinghua UnionPay Advisors Real Estate Index, and Australian exports.
Stocks and commodities began their rally in mid-February after China’s central bank stepped up efforts to restore stability to the yuan and the Chinese economy. China is the world’s second largest economy and the largest consumer of copper and other base metals. The hope of economic stimulus in China has helped spread optimism across global markets. On February 15, the yuan surged the most in a single day against the dollar in over a decade. Global stocks, as tracked by the MSCI All Country World Index, have risen 10% the since the Feb 11 low. Copper futures gained 13% and oil futures are up 37% from February 11 to March 4.
At the start of China’s annual National People’s Congress over the weekend, the government signaled increased support for the economy through higher spending and policy measures to boost lending. The country's GDP growth rate target for this year was set at 6.5-7.0%, supported by an increase in spending that would lift the budget deficit target to 3% of GDP.
While the Chinese government’s efforts to support the economy have prompted the return of some optimism by market participants, a sustained rally will likely depend on those efforts actually working. The data produced by the government statistical agencies in China on borrowing, spending, production, and profits can offer some indication, but the official data may just say what the officials want it to.
Fortunately, we can point to five indicators that provide independent insight into whether the Chinese government’s efforts are working:
1. Caixin China Purchasing Managers Index
2. Commodity prices
3. Baidu SME Index
4. Tsinghua UnionPay Advisors Real Estate Index
5. Asian exports
1) Caixin China Purchasing Managers Index
Purchasing managers indexes (PMIs) are economic indicators derived from monthly surveys of private sector companies. China has two PMIs, one produced by the government, and the other by private financial data provider Markit (known as the Caixin China PMI). Over the past three years, the private sector PMI has consistently provided an overall view of economic activity in China that is weaker than the official PMI.
The latest reading of the Caixin China Composite PMI fell 0.7 points. But where it goes from here matters more than the February reading since a 0.7 point drop is actually typical (as you can see in the chart below) for the month of the Chinese New Year, a weeklong floating holiday when businesses across China are shutdown. A rebound, or at least stabilization in the PMI would suggest policymakers’ efforts are being rewarded, while a further decline would suggest otherwise.
Sharp drop in China’s February PMI is typical for month the Chinese New Year takes place
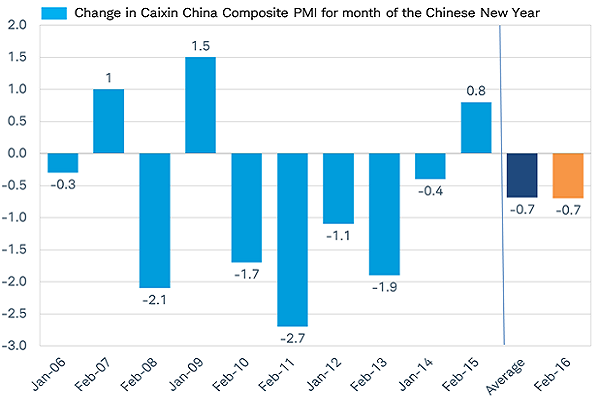
Source: Charles Schwab, Bloomberg data 3/4/2016.
2) Commodity Prices
Historically, one of the best indicators of China’s GDP is China’s official producer price index (PPI), which measures inflation at the wholesale level and is largely driven by commodity prices. As you can see in the chart below, the PPI is pointing to stabilization in economic growth in China in the first quarter of