For 43 consecutive trading days this summer -- nearly two months -- U.S. stocks barely budged. The S&P 500’s one-day move never crept above 1 percent during that time, and the S&P 500’s average one-day move was just six basis points over that period.
That streak stopped when the S&P 500 tumbled 2.5 percent on Friday and then bounced back 1.5 percent on Monday.
It looks like investors expect the market’s newfound jitters to hang around for a while longer. The average value of the CBOE Volatility Index -- a widely followed barometer of expected volatility in U.S. stocks better known as the VIX –- was 12.5 during those 43 tranquil days. The VIX shot up to an average of 16.4 over the last two trading days.
Welcome back, volatility.
Investors are used to the turbulence by now. After all, U.S. stocks have battered investors on three recent occasions -- in August of 2015, in the early days of 2016 and yet again during the tense days that followed Brexit.
Given those bumpy episodes, many investors want to sidestep volatility by piling into so-called "low-volatility strategies" -- funds that invest in stocks that have historically been less volatile than the broader market.
The only problem is that low-volatility funds were anything but that during Friday’s market rout. As Bloomberg News reported, both the PowerShares S&P 500 Low Volatility fund and the iShares Edge MSCI Min Vol USA fund -- two popular low-volatility funds -- were down more than the S&P 500 on Friday.
Oops.
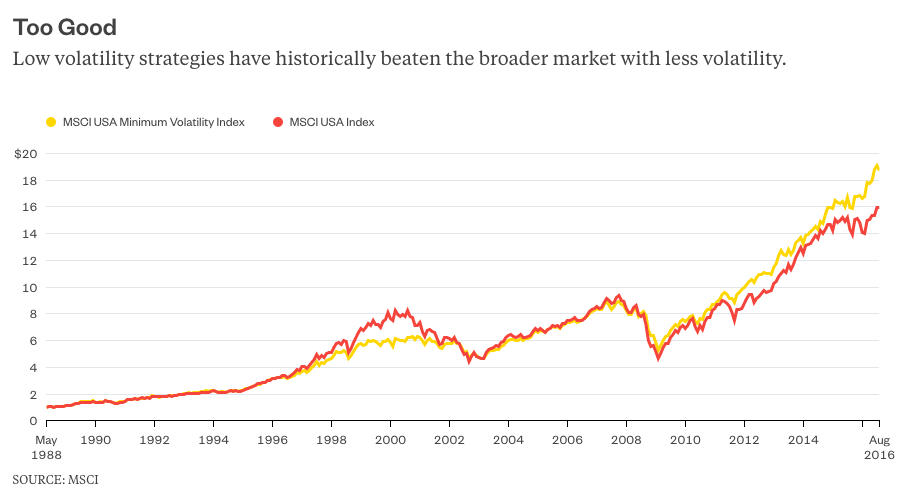
Still, it’s easy to understand investors’ faith in low-volatility strategies because low volatility has achieved investing’s version of nirvana: a higher return than the market with, well, lower volatility.
The MSCI USA Minimum Volatility Index returned 10.9 percent annually from June 1988 to August 2016, including dividends, with a standard deviation of 11.4 percent (the longest period for which data is available). The MSCI USA Index returned just 10.3 percent annually over the same period, with a standard deviation of 14.5 percent.
Low volatility’s resume is just as impressive over shorter periods. The USA Minimum Volatility Index was less volatile than the USA Index 100 percent of the time over rolling five-year periods. The USA Minimum Volatility Index also managed to beat the USA Index 59 percent of the time over those same rolling five-year periods.
But anyone who has ever bought a high-flying fund only to watch it crash and burn knows, as they say in the trade, that past performance is not necessarily indicative of future results. Bear that warning in mind if you're in the market for low-volatility strategies.
For starters, much of low volatility’s success was achieved when no one was looking. The PowerShares and iShares low volatility funds date back to only 2011. The finance graveyard is littered with low-risk-high-return strategies that somehow lost their sheen once investors actually showed up.
And the problem with actual investors, of course, is that they have a pesky habit of driving up prices. The price-to-earnings ratios (excluding negative earnings) of the USA Minimum Volatility Index and the USA Index were 17 and 16.2, respectively, in the third quarter of 2013. But low volatility’s valuation has swelled relative to the broader market since then. Today those same P/E ratios are 23.3 and 20.8, respectively.
It’s no secret that high valuations are a drag on future returns, but there are other ominous signs of potential trouble for low-volatility plays.
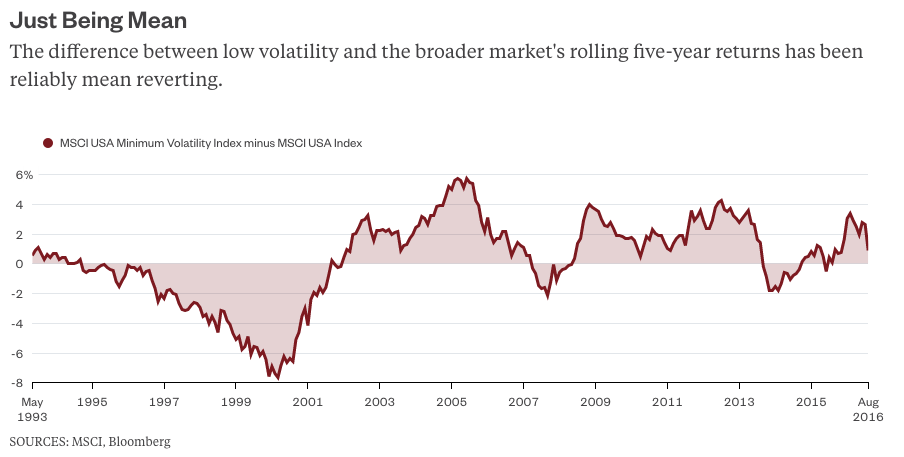
The USA Minimum Volatility Index has historically beaten the USA Index by an average of 0.3 percent annually over rolling five-year periods. When low volatility has managed to beat the broader market by a wider margin than that, its future returns have tended to be more modest or even negative. The USA Minimum Volatility Index has beaten the USA Index by 0.9 percent annually over the last five years through August.
Also, the volatility of low-volatility strategies occasionally approaches that of the broader market. When that happens, low volatility’s returns tend to suffer. The difference between the USA Minimum Volatility Index and the USA Index’s rolling five-year standard deviation last peaked in 2012 at 4.5 percent, and has declined ever since. That difference is just 3 percent today.
Low volatility is one of the few remaining strategies where investors still expect higher returns in exchange for lower risk. Maybe it's time to reconsider.
This column was provided by Bloomberg News.