


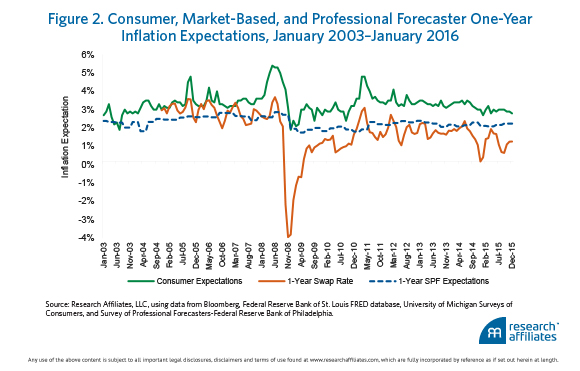
Ideally, the Phillips curve’s expectation proxy would be a measure of firms’ inflation expectations; unfortunately, no such statistic exists and we must rely on another proxy. Three common proxies are plotted in Figure 2: the one-year-ahead inflation forecasts of consumers, financial markets, and professional forecasters. The differences among these series are substantial. In recent years, consumers’ expectations have been systematically higher than other forecasts and actual inflation. In addition, consumer and market-based expectations have been significantly more volatile—suggestive of a higher correlation with oil prices—than those of professional forecasters; hence, using the Phillips curve to model inflation can result in drastically different forecasts depending on the choice of expectations proxy.
We can judge the accuracy of the various proxies by comparing their forecasting errors, reported in Figure 3. We calculate the forecasting error (i.e., the root of the average squared forecast errors) over the 10-year period 2005–2015 for four measures: a constant 2.3%, which is close to the Fed’s inflation target, and forecasts from professional forecasters, consumers, and swap markets.2 The Fed targets the personal consumption expenditure price index (PCEPI), which over the last 15 years has tracked about 0.3% lower than the Consumer Price Index (CPI), also known as headline inflation. We focus on headline inflation forecasts in this article; hence, the selection of our constant, 2.3%.
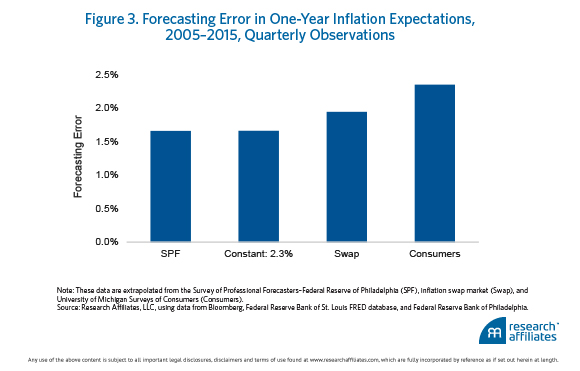
Between 2005 and 2015, consumer and market-based expectations were the least accurate predictors of subsequent year-over-year inflation. As documented by Bauer and McCarthy (2015), inflation swap contracts performed poorly compared to professional forecasters and to the constant. Consumer expectations constituted a particularly noisy signal versus other metrics. Indeed, over the last few years, consumers have systematically overestimated future inflation by about 1.2%. As suggested by Kumar et al. (2015), factors such as the price of gas at the pump and the prices paid in the shops have a great influence in shaping public perception—much greater than the messaging of the Fed.
Ultimately, the economic importance of consumer expectations depends on their underlying driving force. To better understand the factors influencing consumer inflation expectations in recent years, we contrast in Figure 4 the one-year inflation expectation, based on the University of Michigan Surveys of Consumers, with the subsequent realized one-year headline inflation rate for two historical periods: 1979–1994 in Panel A and 1995–2015 in Panel B. The earlier period is characterized by core and headline inflation rates dramatically falling after Paul Volcker took the helm at the Fed. The latter period is characterized by the so-called Great Moderation and the financial crisis, years in which inflation has been roughly stationary.
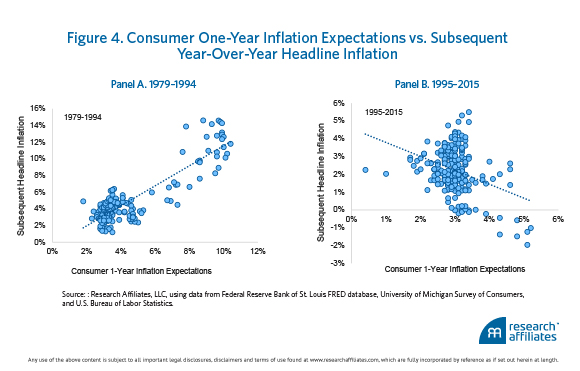
The positive relationship illustrated in Panel A over the 15 years from 1979 to 1994 suggests that during this period households inherently understood changes in trend inflation (i.e., their forecasts shifted downward in tandem with generalized inflation). In contrast, Panel B shows a negative correlation between one-year inflation expectations and subsequent year-over-year headline inflation during the 20-year period 1995–2015. This negative relationship is a product of the oil price dynamics during the financial recession. Over this period, households appear to have assigned a particularly large importance to energy price variations that turned out to hold little information about subsequent inflation. Households likely misunderstood the transitory nature of oil price fluctuations, a situation we might be witnessing again today. Market-based expectations show the same sort of bias, although the causes are less clear and at least partially related to the microstructure of the financial markets.
A Simple Alternative to Inflation Expectations
Given the practical ambiguities in modeling inflation using the Phillips curve, an alternative is to separately analyze each component of CPI. Our approach allows a large degree of modeling heterogeneity across the prices of different goods and services without requiring an explanation of the dynamics within a unique framework.
To use this approach, we disaggregate core inflation from headline inflation, isolating the more volatile CPI subindices of food and energy, which currently represent about 14% and 7%, respectively, of the headline index. Oil’s collapse from about $105 a barrel in mid-2014 to approximately $35 in early March 2016 has been the predominant driver of energy inflation, which fell almost 13% over 2015. Given its importance in the aggregate index, this drop translates into about a full percentage point being subtracted from headline inflation. Food inflation has also been below average, partially due to a strengthening U.S. dollar and cheaper oil, the latter implying, among other things, lower transportation and packaging costs.
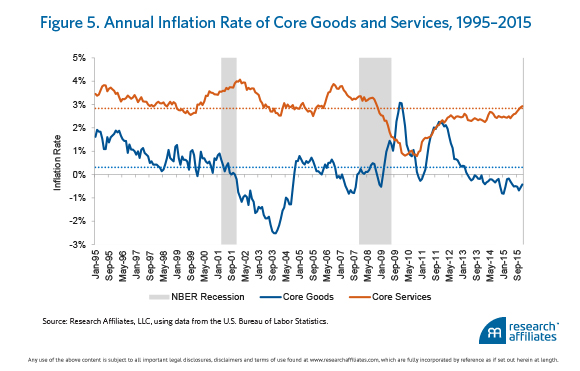
The annual inflation rate of core goods and services, which account for about 19% and 59%, respectively, of headline CPI, offer a blurrier picture, as Figure 5 illustrates. Different dynamics impact these two indices. Goods inflation is closely related to the global economy and to the path of the U.S. dollar because globalization has led to greater foreign competition for U.S. manufacturers. In contrast, services inflation is closely related to the housing market and to the national economy, characterized by lower substitutability of the labor force.
The macroeconomic relationships between goods inflation and the U.S. dollar, and services inflation and the unemployment gap, are captured in Figure 6. Panel A points to a significant negative relationship between the real exchange rate of the U.S. dollar (trade-weighted against the major currencies) and subsequent goods inflation. Both variables are expressed in cyclical terms (i.e., as differences with respect to their 10-year trailing averages). The dollar index is lagged by one year because its effect tends to be felt gradually over time. A year ago, the U.S. dollar exchange rate stood 11% above its 10-year trend versus other major currencies, indicating goods inflation would likely fall by 0.3% in 2015. Realized goods inflation in 2015 was, in fact, −0.4%; hence, a strong dollar has contributed to subpar goods inflation, a phenomenon American consumers should welcome.
U.S. Inflation: The Expectations Game
March 24, 2016
« Previous Article
| Next Article »
Login in order to post a comment