


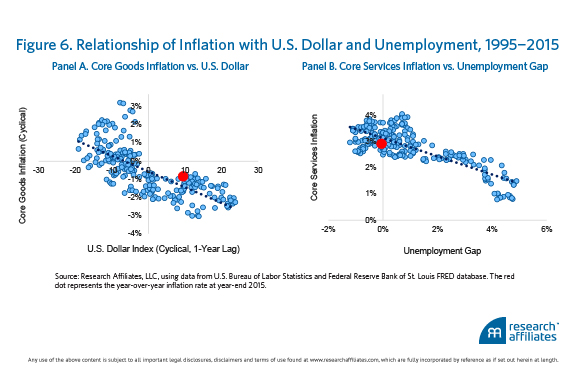
Panel B expresses a similarly powerful relationship between services inflation and the current unemployment gap, defined as the difference between the equilibrium unemployment rate (estimated by the Congressional Budget Office) and the actual rate. A shrinking gap is associated with greater demand for housing and with higher wage pressure, both of which act as tailwinds to services inflation. Today’s unemployment gap indicates that services inflation over the past year should have been 3.2%. Here too the expectation was largely in line with what transpired; services inflation rose by 2.9% in 2015. In light of these relationships and the most recent macroeconomic data, the latest readings of the inflation data are not surprising. In 2015, core inflation was 2.1%, just 0.2% less than what would be anticipated based on Figure 6. Inflation rates are consistent with the historical experience, which indicates we are far from witnessing a major structural break within the U.S. economy.
Michele Mazzoleni , Ph.D., is vice president of macro research at Research Affiliates.
By leveraging this analytical framework, we can compare alternative inflation forecasts for 2016, each associated with a different expected oil price. We employ a simple reduced-form forecasting model, which builds on the relationship highlighted in Figure 6,3 to analyze how headline inflation is likely to evolve if the price of oil should gradually converge in December 2016 to $25.00, $35.00, $40.30, or $48.85 a barrel. A $25.00 price would indicate extended weakness in the global economy, a $35.00 price would represent essentially no change from the current price level, and a price of $40.30 would correspond to the expectation extrapolated from the futures market. A $48.85 price would reflect the median analyst forecast from the survey compiled by Bloomberg.4
The 2016 year-end inflation forecasts derived from the four oil price scenarios are shown in Figure 7.5 In addition, we include 1) the 2015 headline inflation rate, 2) the market’s one-year-ahead expectation at 2015 year-end based on the swap rate, and 3) the forecast from the University of Michigan Surveys of Consumers. Should the price of oil rebound to $48.85 as expected by analysts, we predict 2016 CPI inflation to be around 2%, just short of the Fed’s target. If oil prices remain subdued in the $25.00 to $30.00 range, year-over-year inflation will likely stabilize around 1%, then move higher toward year-end. In contrast, both the inflation swap market and consumers are forecasting an inflation rate outside the range forecasted by reasonable oil price estimates. Once again, the evidence suggests that both consumer and market expectations may be of minimal help in navigating inflation dynamics.

Monetary Policy Still on Target
Despite its best efforts, the U.S. Federal Reserve has failed to earn the full attention of the American public. But this is exactly the reason Fed officials should not be concerned about falling consumer and market-based inflation expectations. Today’s situation is different from that of the 1980s when core inflation dramatically fell from a double-digit peak. Current expectations appear to be mostly influenced by transitory fluctuations in the price of oil. As such, estimating the modern Phillips curve has the flavor of an academic exercise, providing marginal practical insights compared to a more elastic bottom-up view of the inflation index. Should the oil price match analysts’ year-over-year expectations for December 2016, we predict headline inflation to gradually reach the 2% mark by the end of the year, close to the Fed’s target. Monetary policy might be unpopular and confusing, but it is not broken. Investors should be prepared for the Fed to reach its inflation target sooner than what is suggested by popular indicators.
Endnotes
1. For another example, see: http://www.bloomberg.com/news/articles/2016-02-02/oil-s-impact-on-inflation-really-is-transitory-with-one-caveat.
2. Like Bauer and McCarthy (2015), we exclusively investigate the end of the first month of each quarter because this is the time the Survey of Professional Forecasters–Federal Reserve of Philadelphia (SPF) predictions are formulated; the SPF frequency is quarterly.
3. We model the following relationships: 1) energy CPI, a function of oil prices; 2) food CPI, a function of lagged energy CPI; 3) core services CPI, a function of the unemployment gap; and 4) core goods CPI, a function of cyclical fluctuations in the level of the U.S. dollar. For simplicity, we assume unemployment and the U.S. dollar will remain at recent levels; moderate fluctuations in these two variables have only a marginal impact if compared to potential fluctuations in energy prices.
4. The $48.85 price constitutes the median analyst forecast for the average crude WTI Nymex oil price at year-end 2016. The forecasts were made in January 2016.
5. We use inflation data through December 2015 to generate our predictions. The recent gyrations in the oil market do not change the core message of our analysis.
References
Bauer, Michael D., and Erin McCarthy. 2015. “Can We Rely on Market-Based Inflation Forecasts?” Federal Reserve Bank of San Francisco Economic Letter 2015-30.
Dudley, William C. 2016. “The U.S. Economic Outlook and Implications for Monetary Policy.” Remarks at the Economic Leadership Forum, Somerset, New Jersey, January 15.
Kumar, Saten, Hassan Afrouzi, Olivier Coibion, and Yuriy Gorodnichenko. 2015. “Inflation Targeting Does Not Anchor Inflation Expectations: Evidence from Firms in New Zealand.” Brookings Papers on Economic Activity, presented at Fall 2015 Conference.
Surveys of Consumers, University of Michigan, University of Michigan: Inflation Expectation© [MICH], retrieved from Federal Reserve Bank of St. Louis FRED database.
U.S. Inflation: The Expectations Game
March 24, 2016
« Previous Article
| Next Article »
Login in order to post a comment