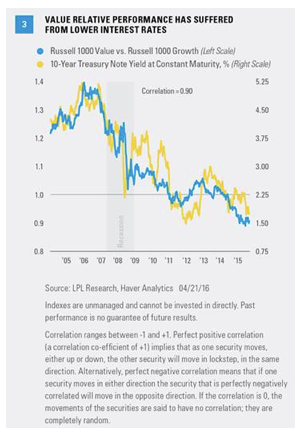
The next biggest value sector, energy, is also a factor in value continuing to lag behind growth. In fact, the fit between the chart of crude oil and value’s relative performance over the past couple of years is just as tight as that of the interest rate chart.
Recently, the tide has started to turn. Oil prices, interest rates, and the financial sector (which are all related) have all moved higher together, fueling better value performance. We see limited near-term upside to all of these, which prevents us from moving aggressively into value at this point.
Slow Growth Environment
One of the main arguments against value (and in favor of growth) in recent years has been the slow global growth environment. When there is not a lot of growth in the economy or corporate profits, then it logically follows that the market would pay a premium for the companies that are generating growth (what we have referred to as motorboats, which can grow without a macro tailwind, as opposed to sailboats, which need economic growth to grow).
The data support this. Over the past 25 years, when economic growth is slow (real gross domestic product [GDP] below 2.5%), growth outperforms value by an average of 4.1%, and beats value two-thirds of the time. The Institute for Supply Management’s (ISM) Manufacturing Purchasing Managers’ Index (PMI) tells the same story. In years when the ISM Manufacturing Index is below average (under 52), growth outperforms value by an average of 3.3% and beats value 64% of the time. And when S&P 500 profits grow at below-average rates (below 7%), growth outpaces value by an average of 6.4%, and beats value 64% of the time.
Value prefers stronger economic and profit growth than we are experiencing today, another check in the growth column. We may not have above-average economic growth this year, but we do expect better economic growth this year than last (as noted in our Outlook 2016 publication); and based on consensus estimates, we believe earnings have a reasonable chance of returning to average growth rates by year-end. This is hardly a strong case for value, but it does suggest keeping allocations fairly well balanced.
Is There Value In Value?
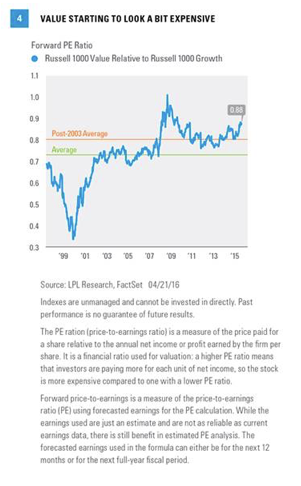
Valuations are another consideration in the style decision. Naturally, value stocks will be cheaper than growth almost all of the time because valuations are used to classify the securities. Since the late 1990s, only once was the Russell 1000 Value Index more expensive on a forward price-to-earnings (PE) basis than the Growth Index: May 2009. Value earnings were depressed—much more so than growth—immediately following the financial crisis, putting upward pressure on value’s
Although valuations do not have a lot of predictive value month to month, we would suggest that for intermediate- to longer-term investors, value looks expensive. The Russell 1000 Value Index is trading at a 12% discount to its growth counterpart, compared to its 18-year average discount of 27%. Even if the tech boom is removed—a period when growth was dramatically overpriced—and we just look at the last two economic cycles (2003 and the present), value is still currently 8% more expensive than its average [Figure 4].
Technical Take
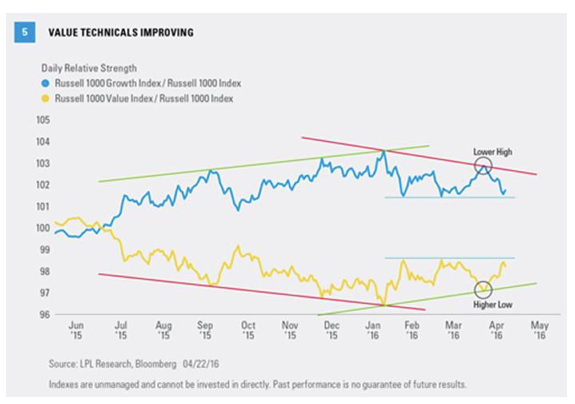
From the perspective of technical analysis, the Russell 1000 Value Index’s relative strength trend compared with the style-neutral Russell 1000 Index has been moving higher since January 2016, while the Russell 1000 Growth Index’s relative strength trend is moving lower. This means that the Russell 1000 Value is outperforming the Large Cap Index, whereas the Russell 1000 Growth is underperforming. The latest leg of the value rebound has been driven by technology sector weakness after disappointing earnings last week (April 18–22, 2016), coupled with financials’ recent strength.
The daily relative trend line for the Growth Index initially reversed in January 2016, and since then has made a lower high, confirming a downtrend. Correspondingly, a higher low for the Russell 1000 Value Index relative strength line confirms an uptrend [Figure 5].
The longer trends may have reversed, but they are near major areas of support and resistance, indicated by the blue lines in Figure 5. Should the blue lines give way, this would be further confirmation that value’s relative strength is suggesting a major longer-term change in trend. Should the trends cross resistance/support, it would suggest another leg higher for value’s relative performance.
Conclusion
After growth outpaced value for the better part of the last decade, value is starting to show signs of life. We are a bit skeptical that the recent value resurgence is the beginning of a sustainable trend reversal, but we acknowledge that the scales have started to tilt a bit more toward value and its run may not be over. A potential pickup in economic and earnings growth, rising interest rates, and higher oil prices are key factors we will be watching to monitor this trend, in addition to valuations and technical analysis.
Burt White is chief investment officer for LPL Financial.
PE ratio.