


The yield curve has a perfect track record of forecasting recessions over the past 50 years. The yield curve has inverted (long-term yields are lower than short-term bond yields) between 5 and 16 months prior to each of the last 7 recessions, giving markets an early warning sign prior to the start of an economic downturn [Figure 1]. This is one reason why a measure of the yield curve is included in LPL Research’s Five Forecasters—a measure of five early warnings signals of a looming recession (see our recent Weekly Market Commentary, “Five Forecasters: Few Warning Signs”).
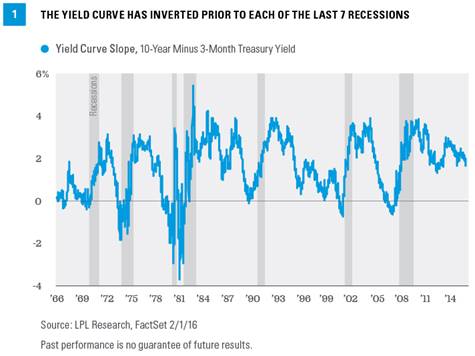
The current shape of the yield curve suggests the bond market is far from signaling a recession. The yield curve has indeed flattened steadily in recent weeks and, coupled with a tough start to 2016 for stock markets and sluggish 0.7% growth in the U.S. economy last quarter, investors are once again turning to the yield curve to assess the future. The slope of the yield curve, as measured by the yield differential between the 3-month T-bill and the 10-year Treasury, remains far away from inverting, as Figure 1 also illustrates.
(Yield curve is a line that plots the interest rates, at a set point in time, of bonds having equal credit quality, but differing maturity dates. The most frequently reported yield curve compares the 3-month, 2-year, 5-year, and 30-year U.S. Treasury debt. This yield curve is used as a benchmark for other debt in the market, such as mortgage rates or bank lending rates. The curve is also used to predict changes in economic output and growth.)
DOES THE YIELD CURVE STILL WORK?
The Federal Reserve’s (Fed) extraordinary policy, holding interest rates near zero for so long and making massive bond purchases, has led to market distortions and raised questions as to whether the yield curve is still a valid indicator. With the Fed holding short-term rates near zero, an inverted yield curve appears much less likely, given that the 10-year Treasury yield has never fallen below 1.39% (the July 2012 low). The 10-year Treasury yield would have to fall significantly to drop below current short-term yields to invert. Alternatively, inversion could occur more feasibly with a combination of lower 10-year yields coupled with rising short-term yields.
MULTIPLE MEASUREMENTS
We believe the yield curve still works as an indicator, but accounting for the extraordinary policy of central banks around the globe suggests that multiple measures of the yield curve may need to be analyzed. Alternative measures such as yield differential between the 2- and 10-year [Figure 2], 5- and 10-year, and 10- and 30-year Treasury yields are also reliable indicators of recession, as each has also turned negative prior to the past three recessions. Our preferred measure of the yield curve is the differential between the 2- and 10-year Treasury yield, as each represents a market-based yield measure, less influenced by Fed policy but also reflecting short- and longer-term bonds.
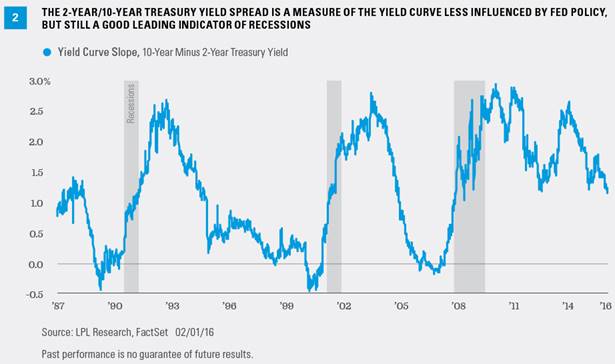
The current yield differential between 2- and 10-year Treasury yields is 1.14%, just under the long-term average of 1.20%. Therefore, the yield curve does not appear to be in danger of an immediate inversion and the slope of the curve is in-line with the longer-term average. Figure 2 also shows that during most economic expansions, including the current one, the yield curve has flattened for periods of time before reversing course and steepening (a rising yield differential). So, a flattening yield curve trend does not necessarily mean a recession is around the corner and may only indicate a soft patch reflecting the changing speeds of economic growth.
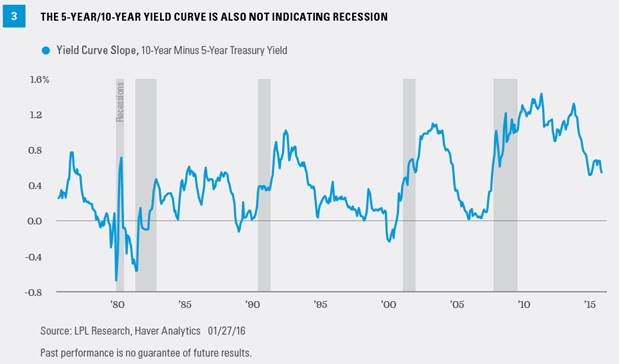
One of the least influenced measures of the yield curve is the yield differential between the 5- and 10-year Treasury yield [Figure 3]. The 5-year Treasury was not among short-term notes sold during the Fed’s Operation Twist and is less influenced by changes in the target fed funds rate (compared with the 3-month T-bill), while the 10-year Treasury was not targeted in the Fed’s most recent bond purchase program. A look at the yield curve as measured by 5- and 10-year Treasuries reveals a similar pattern and one that also is far from signaling a recession. In January 2016, the yield gap actually increased (not shown on chart), suggesting a modest improvement in growth expectations, but more likely simply a response to reduced market rate hike expectations and last week’s market-friendly Fed statement.
THE YIELD CURVE’S MESSAGE
While we believe the yield curve still works as a recession indicator, there are no guarantees in financial markets. Overseas government bond markets have not signaled oncoming recessions with an inverted yield curve. The Japanese yield curve did not invert prior to the Great Recession. The German government bond yield curve flattened to 0% ahead of the Great Recession but failed to invert, or get close to 0%, in the subsequent 2011 recession.
Additionally, the level of central bank involvement in financial markets and extraordinary policy measures may cloud the effectiveness of this tool. Still, the message from the yield curve has not changed. A flatter yield curve means slower growth. As the market’s expectations of future growth fall, longer-term rates may fall, or not rise as quickly, relative to short-term yields, and the yield curve may flatten in response. Conversely, a steeper yield curve reflects improving economic growth expectations.
Although the Fed's current policy of holding down short-term rates may cloud the message of the yield curve, it still remains a valid indicator. Yield curve measures that stay away from the shortest-term maturities, which the Fed has the most control over, may still be useful for identifying the threat of recession. The flattening yield curve should not signal the end of the economic expansion, nor should recent events suggest the end of the yield curve as a key indicator.
Anthony Valeri is investment strategist for LPL Financial.