Election years have historically been good for stocks, and this year has been no different, although with less volatility than we would expect during the summer of an election year. That relative calm may partly reflect that the market is increasingly pricing in greater certainty that would come with a Hillary Clinton victory, as her support has climbed in the polls. This week we look at what the stock market and some politically sensitive industry groups may be telling us about the potential outcome of the presidential election in November.
WHERE’S THE ELECTION YEAR VOLATILITY?
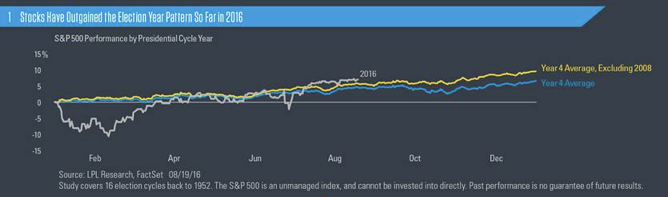
Election years have historically been good for stocks, though with some volatility, as we wrote in our election themed Weekly Market Commentary back in May (“What Might Trump the Election Year Pattern?”). That volatility during election years has historically come during the middle and late summer months—in other words, about now. Although each cycle is different (especially 2008), in recent decades we have observed that the volatility tends to subside, and a late-year rally ensues, when markets have more clarity on the candidates’ platforms and start to price in a winner.
So where has the volatility been this summer? As shown in Figure 1, the S&P 500 has gone up in nearly a straight line since mid-February, with a very short-lived interruption for Brexit before continuing its advance. This year’s gains have exceeded the average election year’s gain going back to 1952 (6.6%) and are on track to outgain the average election year, even if 2008 is excluded (9.6%).
Certainly improving economic conditions have played a key role in the stock market’s steady gains over the past six months. But we believe the market has begun to price in strong odds of a Clinton victory as her lead in the polls has increased, which brings more predictability than a Donald Trump administration. There is still uncertainty to clear up in terms of both candidates’ agendas, as well as what they could actually get through Congress, which could lead to more volatility. The Senate could go either way at this point, while some nonpartisan, and even right leaning political pundits acknowledge that the Republican’s House majority may even be at risk in the event of a Clinton landslide victory.
THE STOCK MARKET’S VOTE
We can speculate that recent stock market gains partly reflect greater certainty under a Clinton administration. But polls can be wrong (case in point: Brexit). It’s possible that the market’s strength has little to do with the election. So perhaps a better question to ask is: Do strong stock markets predict elections?
It appears at this point that the stock market’s vote is aligned with the polls. Since 1928, a stock market increase over the three months leading up to the November presidential election has an 82% success rate at predicting the winner [Figure 2]. In 18 of the 22 election years going back to 1928, the gain or loss in the stock market over August, September, and October accurately predicted which party won. For years in which the election followed a two-term president (1940, 1944, 1960, 1988, 2000, and 2008), the track record has been perfect, but granted, this covers a limited number of occurrences.
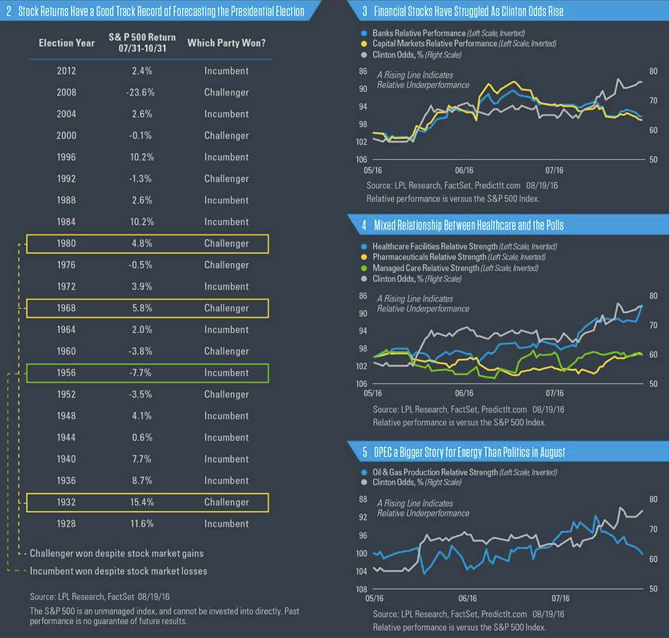
The exceptions to the “vote of the stock market” are 1932, 1956, 1968, and 1980, when the challenger won despite stock gains, or when the incumbent won despite a stock market decline over the period. No market indicator is perfect for every election; however, the stock market’s vote has been fairly predictive over the years and suggests that the stock market and the polls are in agreement, at least for now.
The performance of the U.S. economy, and specifically income growth, is also a good predictor of election outcomes, as we noted in the Midyear Outlook 2016: A Vote of Confidence. This indicator is suggesting a slight edge for the Democrats.
ARE POLITICALLY SENSITIVE GROUPS AND POLLS ALIGNED?
The broad market’s performance may be telling us something about the November election, but what about some of the most politically sensitive industries? If the market was pricing in a Clinton victory, certain industries where her platform may not be as supportive would be expected to lag the market (and vice versa). We looked at the relative performance of several politically sensitive industry groups to see if they were aligned with a market-based version of a presidential election poll to determine if their performance might be telling us something about the potential outcome in November.
Financials
Clinton is likely to be much tougher on bank regulation that Trump. She has supported tough financial regulation under the Dodd-Frank law, while Trump has indicated his interest in dismantling the law. Clinton has indicated that she would be willing to break up financial institutions deemed “too big to fail.” She would propose a risk fee for big banks and financial institutions based on their size and their risk of contributing to another financial crisis. Both Clinton and Trump have included reinstating Glass-Steagall as part of their platforms, which prohibits commercial banks from engaging in investment banking.
What is the market saying? As shown in Figure 3, from mid-May (when the two nominees became clear) through the end of July, the odds of a Clinton victory tracked the (inverse) relative performance of bank and capital markets stocks. We believe prospects of a continued tough regulatory environment, including the anti-Wall Street rhetoric (even if Glass-Steagall faces very long odds of being reinstated), played a role in the relative weakness of these groups during that time.
But during the last couple of weeks, as Clinton’s odds of winning increased in the polls, financial stocks did well. Gains in these stocks in August likely reflected the move in interest rates, from 1.46% on the 10-year Treasury at the end of July to just shy of 1.60% late last week, which may have overwhelmed politics. Alignment between market and polls: Good.
Healthcare
Clinton is a strong defender of the Affordable Care Act (ACA) and arguably one of the early architects of some of the law’s basic concepts. Trump, on the other hand, has stated his interest in repealing it, a key pillar of the Republican platform. Both candidates have expressed support for the government (Medicare) to negotiate drug prices directly to help bring down prescription drug costs, though Clinton has more credibility on this issue than Trump.
What is the market saying? The ACA means more insured patients, so the healthcare facilities and managed care groups should have done well recently as Clinton’s odds of winning have increased. But as shown in Figure 4, they really haven’t, especially facilities (remember the relative performance lines are inverted). Some of this inconsistency, we believe, reflects the profitability challenges for certain healthcare institutions under the ACA. Pharmaceutical stock relative performance has only begun following its expected path (inverse correlation to Clinton’s odds) over the past month. The weakness of this link, besides various company specific issues, may be due to the market’s expectation that, even in a Democratic administration, it is unlikely that major drug reforms will get through Congress. Alignment between market and polls: Mixed.
Energy
The candidates have very different approaches to energy policy. Clinton wants to reduce American oil consumption by a third through cleaner fuels and more efficient cars, boilers, ships, and trucks. Trump, on the other hand, has talked about reducing regulations for drilling, approving the Keystone XL pipeline, and put one of the pioneers of the oil and gas shale revolution on his economic advisory council.
What is the market saying? Drawing comparisons between energy and policy is tricky because of the many macroeconomic factors that drive oil and the tight relationship between oil prices and oil stocks. Still, oil and gas exploration and production stocks did underperform from mid-May through the end of July as Clinton’s odds improved [Figure 5]. The outperformance of energy stocks in August, despite Clinton’s improving odds, has been driven more by anticipation of an OPEC production agreement next month than politics. Alignment between market and polls: Fairly close until recently.
What About Infrastructure?
Both candidates have supported infrastructure spending, such as fixing roads and bridges, to help stimulate the economy and increase employment. In what has been more of a Democratic position in recent years, Trump has proposed to spend double Clinton’s $275 billion over the next five years. All things considered, the candidates have not differentiated themselves much on this issue (similar to international trade, which both would like to restrict to varying degrees). Not surprisingly, construction materials stocks did quite well early this summer as Trump’s plans became clearer.
CONCLUSION
The broad market seems to be in alignment with the polls in suggesting a Clinton victory in November is likely, although anything can happen. The lack of market volatility in recent months may reflect the market’s preference for less uncertainty under Clinton’s leadership, while financials stocks, which would be expected to do better under Trump, have generally struggled as Clinton’s odds of victory have risen. The messages from other politically sensitive groups including healthcare and energy are more mixed. We will continue to watch for signals from the market as to what may happen in November, as we can all agree, regardless of one’s political leanings, that this election will have investment implications.
Burt White is chief investment officer for LPL Financial.