What are retirees really looking for? Like any human being, they are more comfortable if they can gauge their chances of success before launching an investment plan. Specifically, for many retirees and their financial advisors, their planning starts with trying to achieve the “4 percent rule” – that is, if they take out 4 percent of their portfolio value each year, it is assumed that their money will last about 30 years. Now, as much as the 4 percent rule of retirement spending is being criticized these days, it is still the closest thing our industry has to an agreeable figure.
Regardless of what figure we use as a retiree’s benchmark, what we want to know is whether their chances of achieving it are as strong in the future as they have been at other points throughout history? The goal of this article is to address a critical question for retired and pre-retired investors (which I assume to be those three to five years from retiring).
Can a person rely on making 4 percent per year for the next 30 years (to withdraw and live on) using the same traditional methods that were successful during the past three decades? I recently approached this along with my analyst, Mark Jakupcik, with the aim of drawing conclusions about how investors can prepare for what could happen if bond market history repeats itself. Given where U.S. benchmark interest rates are today, this should be a concern for all retired/retiring investors, many of whom are counting on something like the “4 percent retirement withdrawal rule” as a guide to avoid outliving their money.
We Know Only What We Have Experienced
I have consistently found that most investors and their financial advisors know and understand the times they have lived through as investors, but not much before then, other than the single, giant period from 1926 to the present. My fear is that investors are so jaded and comfortable following the friendly markets of the past three decades that they don’t see the possible hurricane on the horizon. Sure, there are plenty of articles about the possibility of rising interest rates in the next decade and beyond. But studies of retail investors consistently find that about two-thirds of those surveyed do not even know that rising rates cause bond prices to decline. And if you look at how much money has flooded into bond funds during the last several years of historically low interest rates, you can see that public opinion still largely regards bonds as “safe” investments. This is an accident waiting to happen, all because the conditions that existed before they were conscious of investment markets are unknown to them. If they did not live through it, they don’t know it and don’t care to.
To study this, we looked at the last two 30-year consecutive periods: December 31, 1953 – December 31, 1983, and December 31, 1983 – December 31, 2013.
What was the key difference between these two periods? In the latter, rates generally fell, and in the former, they generally rose. 1953 ended with the 10-year at 2.48 percent, near an all-time low. By 1983, rates had moved all the way up to 11.67 percent (after peaking at over 14 percent during 1982). Then, rates fell again, finally closing 2013 at 2.67 percent, completing essentially a 60-year round trip.
Why not go back to 1926 like so many others do? We used the Ibbotson data (sourced from Morningstar Direct), but only back as far as we consider relevant to the task at hand. We were tempted to study that total period covered by Ibbotson’s data (back to 1926), as many do. But it occurred to us that what happened during the Great Depression and during WWII are a bit too far back to serve as models for what could happen from here.
We produced two sets of data to review:
1. The probability in each period of producing a return of 4 percent or greater over a five-year time period.
2. Isolating returns of high-quality bonds during each period to see the difference between their contribution to achieving the 4 percent rule during the rising-rate and falling-rate eras.
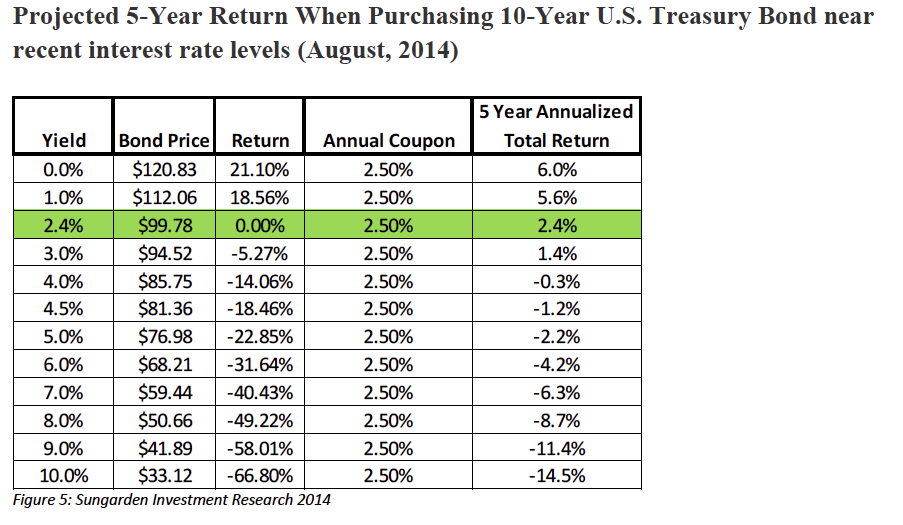
3. Projecting returns of the 10-year U.S. Treasury bond from current interest rate levels.
Why a five-year period? We think that’s about how much time the patient client will give an advisor to show they are worth paying for. We studied rolling five-year periods in which we shifted the date range by one month each time, then recorded the returns for the asset classes and portfolio mixes we studied. This gave us 360 different five-year rolling periods within each 30-year investment era, a large sample size.
Now, consider the plight of the retiree expecting to live for 30 years. Like Forrest Gump’s mother said about a box of chocolates, “You never know what you are going to get.” They may get an environment like Period 1, Period 2, anywhere in between or something completely different. The question is, what are they prepared for, and once they become conscious of what CAN happen, what WILL they do now to plan for the possibility that the last 30 years are NOT a good guide to the future?
Summary Of Results And Historical Charts
When comparing the two time periods (1953-1983 and 1983-2013), we present the more recent period first. We did this on the assumption that most investors and advisors are more familiar with the last 30 years than they are with the previous three decades of market history. Here is what we concluded:
1983 - 2013: Stocks were a good contributor, but bond returns were even better. This is a historical anomaly. The last 30 years were about as good as it gets for bonds. In fact, bonds were nearly “automatic” to generate 4 percent annualized over a five-year period. And the chart 3 shows that even deducting 4 percent at the end of each year for an assumed withdrawal, the bond allocation kept growing. Interestingly, in a period of general bullishness for stocks, the S&P 500 only met the 4 percent threshold less than three quarters of the time. This underscores the boom/bust character of stock index investing. In fact, a hypothetical portfolio of 50 percent in S&P 500 and 50 percent in a zero-return asset (shown on the chart as “50% S&P”) was successful in reaching the 4 percent goal nearly as often as the fully-invested S&P 500 Index.
1953 - 1983: Using bonds made sustaining the 4 percent annual withdrawal difficult. Stocks drove returns over this time, as rising interest rates were a frequent headwind for bonds. Success rates for long-term bonds during this period were less than half of what they were in the earlier era. And as shown in Chart 4, long-term bonds (Treasury and corporate, the types which are heavily weighted in many bond funds), when adjusted for a 4-percent end-of-year withdrawal, could not even get back to original $1 million … after 30 years! Even intermediate bonds suffered, and were less successful than the 50% S&P “portfolio.”
Today the math is solidly against bonds contributing sufficiently to a 4 percent annualized return, much less a positive return at all. Chart 5 shows that the 10-Year Treasury bond could drop to zero (which would imply much bigger problems for investors), and investors would still only make 6 percent a year for five years. That is how low rates are and how tough a climb it is. Don’t count on bonds getting you to your retirement promised land for a while. Let’s face it, the current interest rate environment is a lot more like 1953 than 1983.
Chart 1
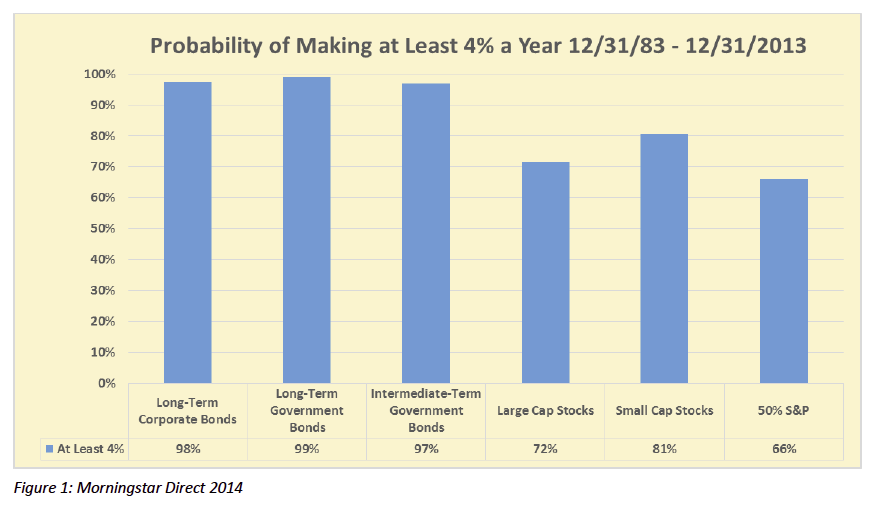
Chart 2
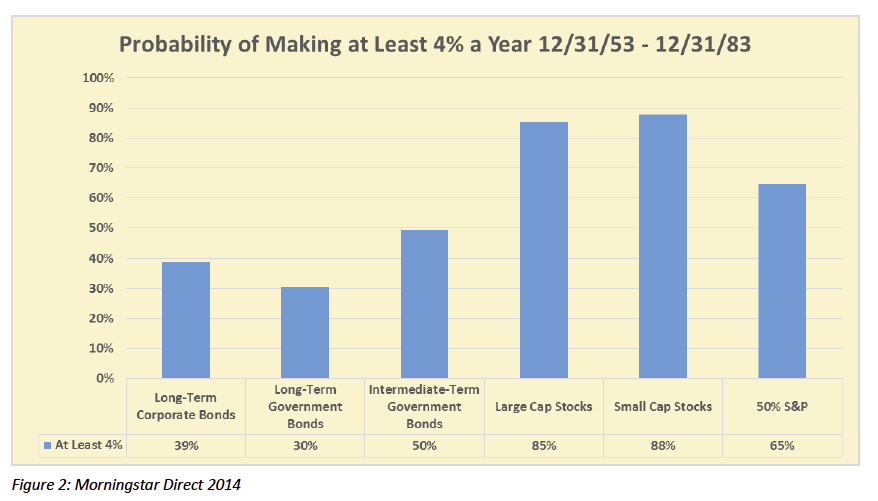
Chart 3
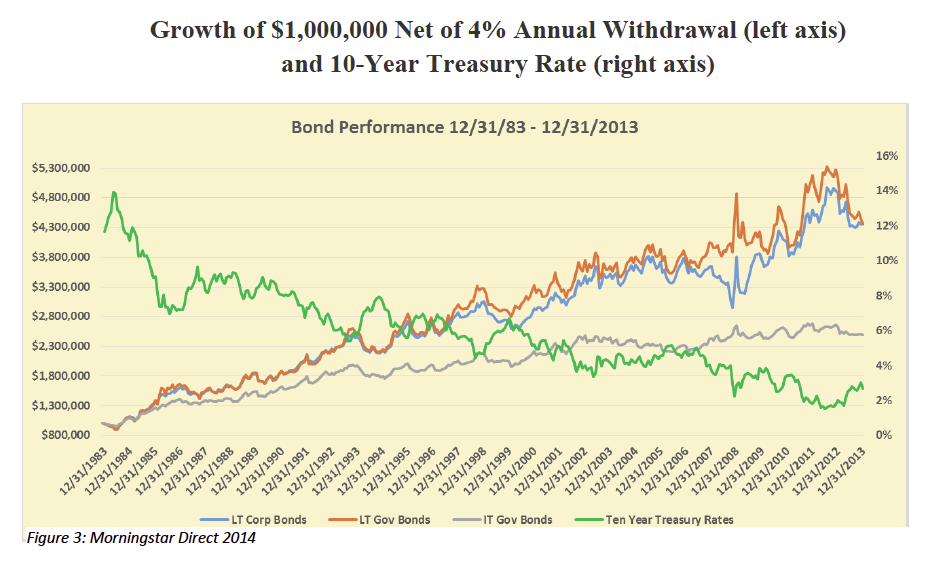
Chart 4
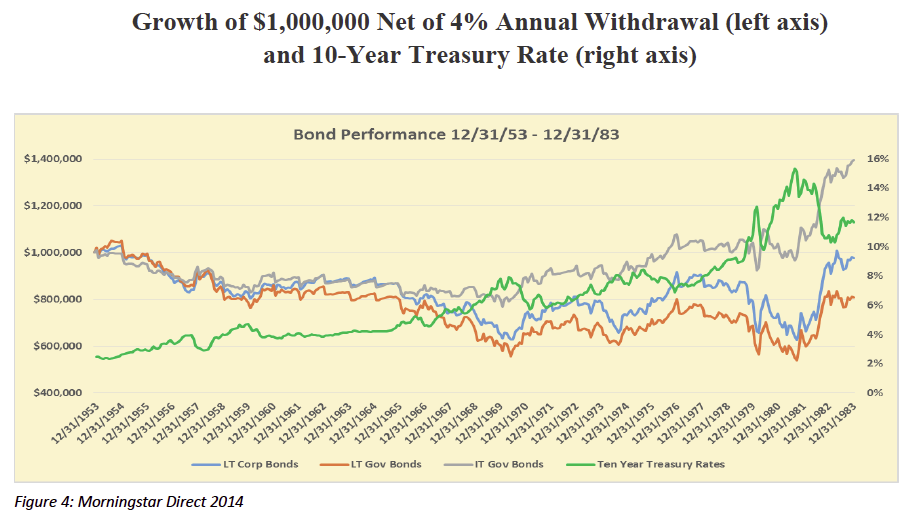
Chart 5
Investment Implications
What are we to do with these circumstances? Let’s take our thought process forward, one step at a time:
• Stocks deserve to be a core portion of most retirement portfolios. Despite their inherent volatility, they have several benefits to the retiree, not the least of which is high liquidity.
• High-quality bonds should be de-emphasized, even eliminated from retirement portfolios, given the precarious historical position of interest rates. And, given the example above of just how damaging a bond bear market can be, we suggest that investors and their advisors stop thinking about how to navigate through the bond portion of their portfolio. Instead, they should strongly consider avoiding bonds altogether.
• However, avoiding bonds leaves the traditional asset allocator with and equity-only portfolio, which is not a good match for many retirees' risk tolerances, and likely does not produce sufficient, reliable cash flow to fund 4 percent annual distributions. What can we do to curtail stock market volatility AND make up for what we used to get in income from the bonds?
• Shedding high quality bonds is a tough leap for many investors and advisors. Contemporary investors are very familiar with equity bear markets, but most have not experienced a bond bear market. The only reason a looming bond bear market is not dominating investors’ minds and planning is because it has not started yet. They may soon find themselves scrambling to figure out what to do, since they have never had to deal with a bond bear market in their lifetime.
• This all points to the same conclusion: Investors should determine how to best complement their core equity portfolio with some form of alternative investment strategy. There is already a wide variety of approaches being practiced, in what has become a feeding frenzy for product providers and money managers. Despite this, there is still room for innovation in this area.
• I think the logical complement to the stock-bond portfolio is a long-short stock portfolio, with an income emphasis. This effectively combines and equity-income approach with a bear-market strategy, to be allocated flexibly as markets change over time. To date, long-short has generally been about preservation and growth, and not retirement income.
Robert Isbitts is founder and chief investment strategist for Sungarden Investment Research.