


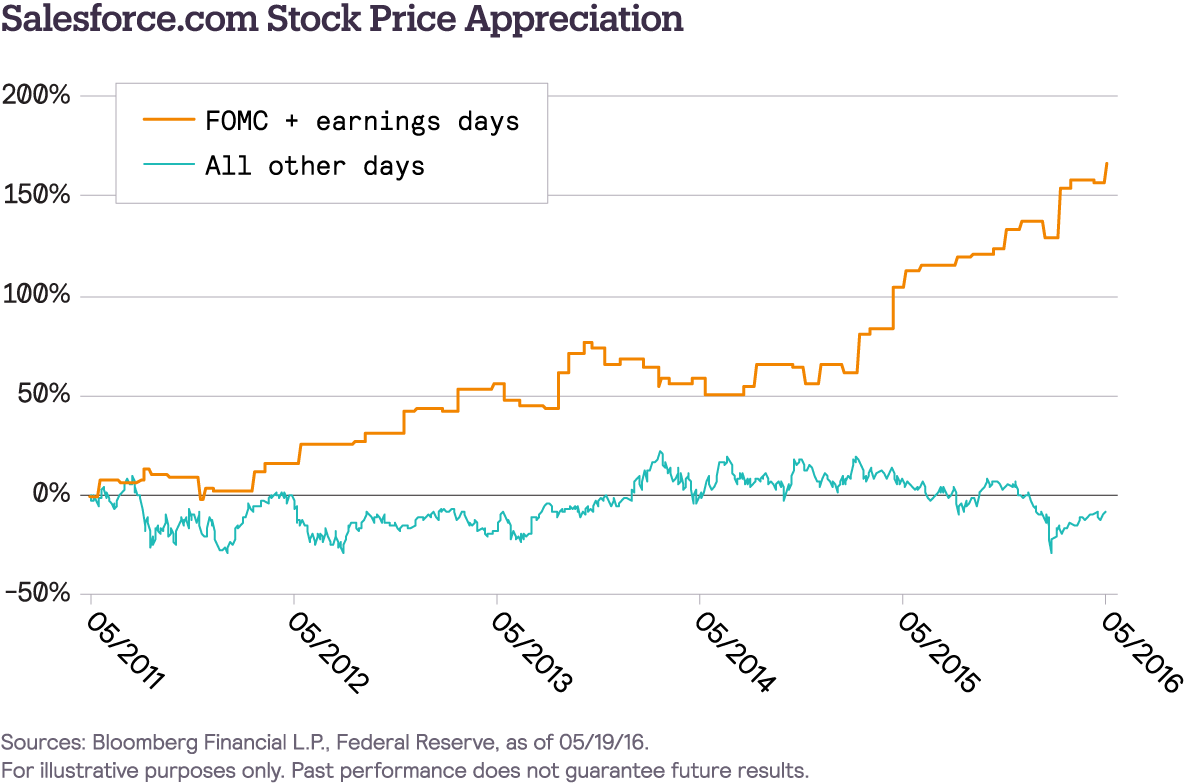
My favorite example of a “story stock” is Salesforce.com (ticker CRM), a $55 billion market cap technology company with 19,000 employees and about $6.5 billion in revenues. I’m pretty sure that Salesforce.com has never had a single penny of GAAP earnings in its existence (in FY 2016 the company lost $0.07 per share on a GAAP basis). Instead, the company is valued on the basis of non-GAAP earnings, but even there it trades at about an 80x multiple (!) of FY 2017 company guidance of $1.00 per share. Salesforce.com is blessed with a master story-teller in its CEO, Marc Benioff, who – if you’ve ever heard him speak – puts forth a pretty compelling case for why his company should be valued on the basis of bookings growth and other such metrics. Of course, the skeptic in me might note that it is perhaps no great feat to sell more and more of a software service at a loss, particularly when your salespeople are compensated on bookings growth, and the cynic in me might also note that for the past 10+ years Benioff has sold between 12,500 and 20,000 shares of CRM stock every day through a series of 10b5-1 programs. But hey, that’s why he’s the multi-billionaire (and a liquid multi-billionaire, to boot) and I’m not. Here’s the 5-year chart for CRM:
Not bad. Up 138% over the past five years. A few ups and downs, particularly here at the start of 2016, although the stock has certainly come roaring back. But when you dig a little deeper …
There are 1,272 trading days that comprise this 5-year chart. 21 of those trading days, less than 2% of the total, represent the Thursday after Salesforce.com reports quarterly earnings (always on a Wednesday after the market close). If you take out those 21 trading days, Salesforce.com stock is up only 35% over the past five years. How does this work? What’s the causal process? Every Wednesday night after the earnings release, for the past umpteen years, Benioff appears on Mad Money, where Cramer’s verdict is always an enthusiastic “Buy, buy, buy!” Every Thursday morning after the earnings release, the two or three sell-side analyst “axes” on the stock publish their glowing assessment of the quarterly results before trading begins. It’s not that every investor on Thursday believes what Cramer or the sell-side analysts are saying, particularly anyone who’s short the stock (CRM always has a high short interest). But in a perfect example of the Common Knowledge Game, if you ARE short the stock, you know that everyone else has heard what Cramer and the sell-side analysts (the Missionaries, in game theory lingo) have said, and you have to assume that everyone else will act on this Common Knowledge (what everyone knows that everyone knows). The only logical thing for you to do is cover your short before everyone else covers their short, resulting in a classic short squeeze and a big up day. Now to be sure, this isn’t the story of every earnings announcement … sometimes even Marc Benioff and his lackeys can’t turn a pig’s ear of a quarter into a silk purse … but it’s an incredibly consistent behavioral result over time and one of the best examples I know of the Common Knowledge Game in action.
But wait, there’s more. Now let’s add the Fed’s storytelling and its Common Knowledge Game to Benioff’s storytelling and his Common Knowledge Game. Over the past five years there have been 43 days where the FOMC made a formal statement. If you owned Salesforce.com stock for only the 43 FOMC announcement days and the 21 earnings announcement days over the past five years, you would be UP 167%. If you owned Salesforce.com stock for the other 1,208 trading days, you would be DOWN 8%.
You see this phenomenon clearly in the entire S&P 500, as well, although not as starkly with a complete plus/minus reversal in performance between FOMC announcement days and all other days. Over the past five years, if you had owned the SPX for only the 43 FOMC announcement days over that span, you would be UP 17%. If you owned it for the other 1,229 trading days you would be UP 28%. Over the past two years, if you had owned the SPX for only the 16 FOMC announcement days over that span, you would be UP 5%. If you owned it for the other 487 trading days you would be UP 2%.
So what does an investor do with these observations? Two things, I think, one a practical course of action and one a shift in perspective. The former being more fun but the latter more important.
© Bloomberg Finance L.P. as of 05/20/2016. For illustrative purposes only. Past performance does not guarantee future results.
Okay, Ben, how about other stocks? How about entire indices? Well, let’s look again at that Alerian MLP index. Over the past five years, if you had owned the AMZ for only the 43 FOMC announcement days over that span, you would be UP 28%. If you owned it for the other 1,229 trading days you would be DOWN 39%. Over the past two years, if you had owned the AMZ for only the 16 FOMC announcement days over that span, you would be UP 18%. If you owned it for the other 487 trading days you would be DOWN 48%. Addition by subtraction to a degree that would make Lao Tzu proud.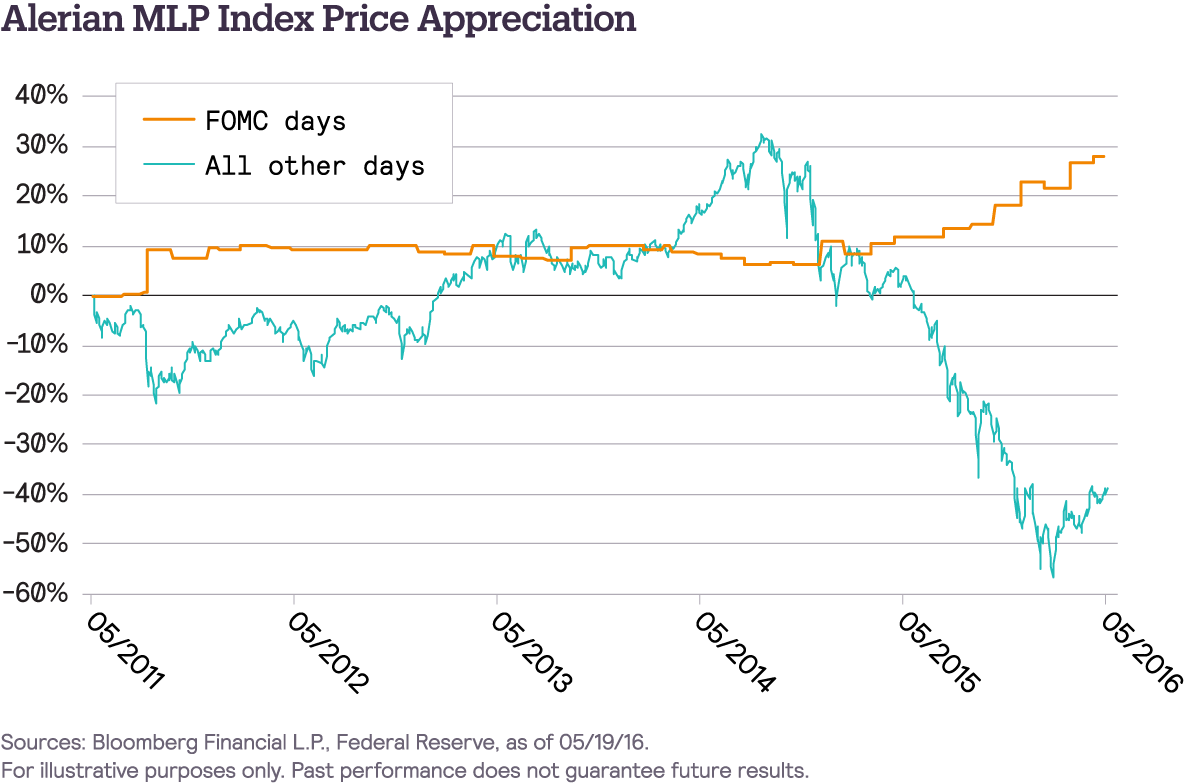
I’ll repeat what I wrote in Optical Illusion / Optical Reality … it’s hard to believe that MLP investors should be paying a lot more attention to G-7 meetings and reading the Fed governor tea leaves than to gas field depletion schedules and rig counts, but I gotta call ‘em like I see ‘em. In fact, if there’s a core sub-text to Epsilon Theory it’s this: call things by their proper names. That’s a profoundly subversive act. Maybe the only subversive act that really changes things. So here goes. Today there are vast swaths of the market, like emerging markets and commodity markets and industrial/energy stocks, that we should call by their proper name: a derivative expression of FOMC policy. Used to be that only tech stocks were “story stocks”. Today, almost all stocks are “story stocks”, and the Common Knowledge Game is more applicable to helping us understand market behaviors and price action than ever before.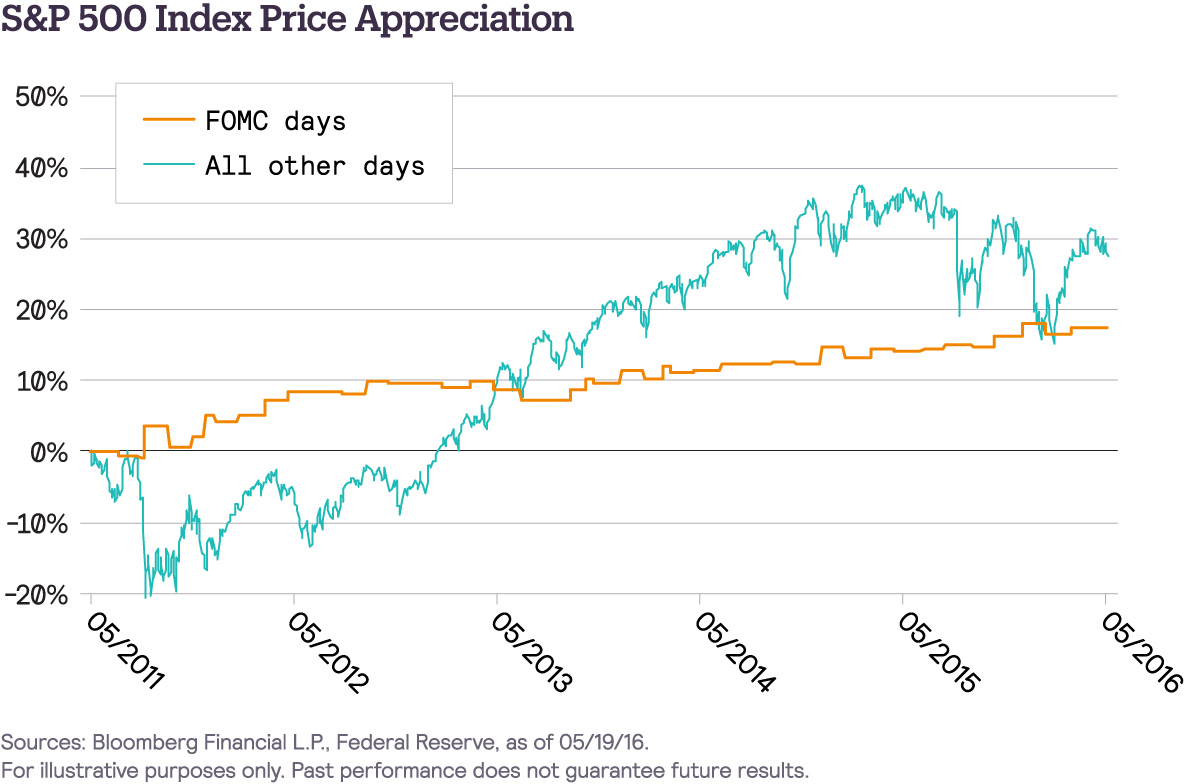
What do I take from eyeballing these charts? The Narrative effect and the impact of the Common Knowledge Game have accelerated over the past two years (ever since Draghi and Yellen launched the Great Monetary Policy Schism of June 2014); they’re particularly impactful during periods when stock prices are otherwise declining, and they’re spreading to broader equity indices. That’s what it looks like to me, at least.