


As expected, this morning’s GDP report wasn't cause for celebration. The initial estimate of economic growth in the fourth quarter of last year came in at 0.69 percent on an annualized basis—well below the previous quarter’s figure of 1.98 percent and even further below the fourth quarter of 2014, which posted growth of 2.07 percent.
Bouncy data, but no recession
In the chart below, we can see a decline in the GDP growth rate from mid-2014. Clearly, with this kind of decay, the economy is tanking and we’re headed into a recession, right? Not so fast.
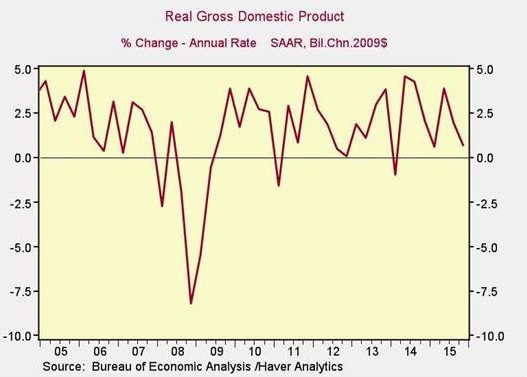
What the chart tells me is that these numbers move around a lot on a quarterly basis. In the recovery so far, we’ve seen two quarters with negative numbers (in 2011 and 2014) and three other quarters that showed growth below that of last quarter. In other words, of the 24 quarters since 2010, more than a fifth of them had results worse than what we see now. And yet, the recovery continued.
I’ve written before about different ways to look at data (a post I recommend both for the topic and for the wonderful Hokusai images I included in it). My point about the benefits of viewing data from different angles also applies here. With that very bouncy data series above fresh in our minds, let’s look at economic growth on a year-to-year basis.
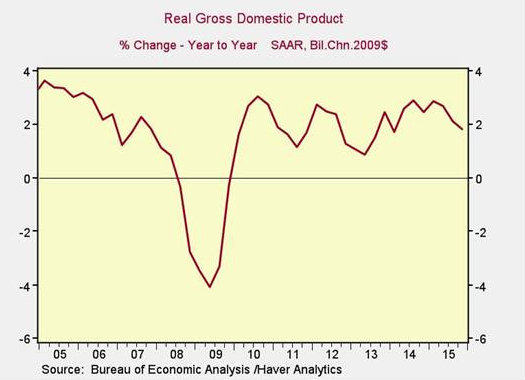
Here, the pullback doesn’t look so bad. We‘ve seen a downturn in the past couple of quarters, but that puts us back at the level of early 2014, not headed into the ground. Although there has been a clear slowdown, growth remains positive and, on a year-to-year basis, not nearly as bad as the quarterly figure suggests.
So, what's behind the slowdown?
There were a few negative factors at work: