Last Wednesday, on March 9, 2016, the bull market officially celebrated its seventh birthday. During that seven-year period, the S&P 500 nearly tripled, gaining 194% in price and producing a total return of 241%. Although our expectations for the stock market in 2016 are for only modest S&P 500 gains, we do not see the warning signs that have signaled the end of past bull markets and would not be surprised at all if the current bull market celebrates its eighth birthday one year from now.
Quick History Lesson
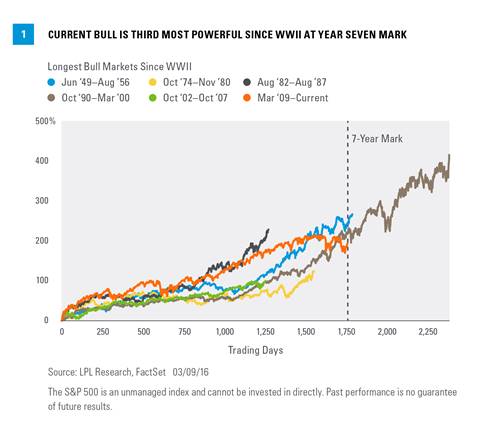
Despite all of the time that has passed, memories of the stock market collapse in 2008 and 2009 remain vivid for all of us. Set up by the severe 2008–09 decline, this bull market has been one of the strongest in history. Going back to World War II, only five bull markets have even made it five years, and only two of those celebrated their seventh birthday, making the current bull market the third longest over the past 70 years [Figure 1].
The previous two bulls to reach the seven-year milestone were June 1949 to August 1956 and October 1990 to March 2000. The rally in the 1950s lasted only one more month than the current bull, but the one in the 1990s lasted two more years. The current bull would have to stay intact until mid-2018 and propel the S&P 500 to over 3440 (up from 2022 on March 11, 2016) to match that epic bull market’s duration and performance.
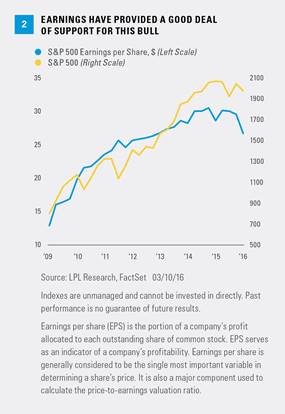
When asked what the biggest driver of these gains has been, many might respond with Federal Reserve (Fed) policy. Certainly, monetary policy stimulus—including quantitative easing (QE) and the so-called ZIRP (zero interest rate policy)—has played a role in powering this bull. But S&P 500 earnings have more than doubled during the past seven years, and thus provided a good deal of support for the market [Figure 2]. Corporate America’s ability to drive profit margin expansion with efficiency gains during this decade is perhaps one of the most underrated pieces of the stock market’s seven-year run.
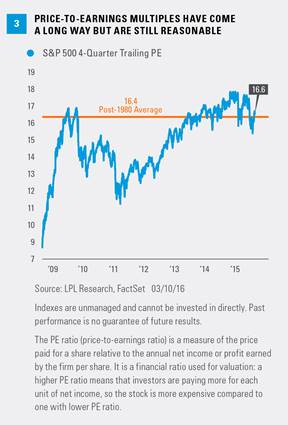
Higher valuations have also played a big role, not surprising given the extreme amount of pessimism at the lows seven years ago. On a trailing four-quarter basis, price-to-earnings ratios (PE) bottomed between 8 and 9 during March 2009 before spiking to 17 later that year [Figure 3]. Interestingly, the S&P 500’s PE is right around 17 today after peaking near 18 last year. Although a PE near 17 may seem high, it is roughly in-line with the average since 1980, and low interest rates are supportive of higher valuations. With some help from the possible resumption of earnings gains in the second half of 2016, we think valuations may be low enough to potentially keep this bull market going at least until its eighth birthday.
Sector Leadership
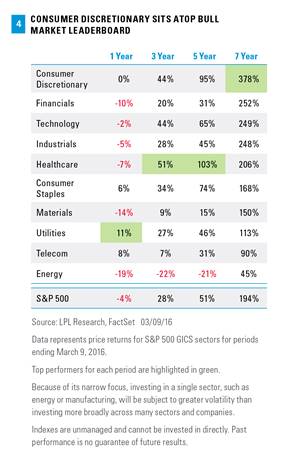
It comes as no surprise that more economically sensitive sectors have led this bull market. Consumer discretionary has led the way with a 378% advance (434% total return), roughly doubling the performance of the S&P 500 and far outpacing financials, the next best sector on a price return basis [Figure 4]. Consumer discretionary benefited from the automotive sector coming back from the edge of the abyss during the financial crisis, from the rebound in consumer wealth (both housing and financial assets), and the meteoric rise of internet retail. Consumer discretionary has been a consistent winner, placing near the top of the sector leaderboard for the one-, three-, and five-year trailing periods.
What may come as a surprise is the fact that financials are so far behind consumer discretionary during this bull. Financials had the steepest decline into the March 2009 lows; at those lows, the sector was pricing in extremely onerous scenarios, such as nationalizing banks, which are unthinkable today. Financials did lead all sectors from those bear market lows through the end of 2009, but began to lose relative strength in 2010 due to low interest rates and new (and tough) regulations, pressures that have not let up since.
Technology and industrials also solidly outperformed during this period as the market priced in economic recovery coming out of the deep recession. Lagging over the past seven years were the more defensive, dividend-paying sectors that investors had turned to on the way down during the crisis, i.e., telecom, up 90%, and utilities, up 113%. But no sector has done worse than energy, up only 45% and a victim to the sharp drop in oil and natural gas prices since the summer of 2014. Remarkably, the energy sector is flat since January 2010.
We continue to favor the technology and healthcare sectors and are waiting for opportunities to become more positive on energy and industrials. Our neutral view on consumer discretionary reflects its historical pattern of mixed performance during the latter stages of bull markets and economic cycles. Furthermore, the sector’s gains from falling oil prices may be mostly behind it. Our recommended underweight sectors include financials, materials, and utilities.
No Recession, But Some Concerns
The indicators we watch that could signal the potential end of the economic cycle and an oncoming recession are currently not showing worrisome signs. Collectively, our Five Forecasters are not showing any cause for concern. We do not see evidence of the excesses in borrowing, spending, or confidence that have ended economic expansions over the past several decades (discussed here). The majority of the indicators we use to assess where we are in the business cycle point to mid-cycle or mid-to-late, rather than late.
That said, although the S&P 500 is one good day away from breakeven for the year, we do have some concerns about this market and maintain a slightly cautious stance in the short term:
1) China. We continue to worry about the potential for China to devalue its currency and spark a currency crisis. A trade war is also a concern given the rhetoric coming from the U.S. presidential campaign trail. At the same time, China’s recent support of the yuan and talk of financial reforms are encouraging.
2) Oil. Oil’s recent resurgence has been a big part of the stock market rebound. Oil is up more than 40% since February 11, 2016 (just a month) and is back to near the $40 level. We are concerned that the rally, based on little more than talk of a production freeze among Russia and OPEC members, lacks a strong enough foundation from production cuts to sustain itself.
3) The Fed. Stocks have historically done quite well after the Fed starts rising interest rates, which it did in December 2015. That said, there is a risk that the Fed hikes rates too aggressively and upsets financial markets and the U.S. economy. (See today’s Weekly Economic Commentary for a Federal Open Market Committee [FOMC] meeting preview.)
4) Earnings. Fourth quarter 2015 earnings season was disappointing. The declining drag from the strong U.S. dollar and smaller energy declines are expected to help earnings growth improve throughout 2016, but the mid-single-digit earnings gains we had initially anticipated for this year may be delayed until 2017.
Conclusion
Stocks may not produce scintillating gains in 2016, but we do expect the bull market to continue despite its age and the aforementioned risks. Bull markets don’t die of old age, they die of excesses. We do not see warning signs that might signal the end of the economic cycle or the now seven-year-old bull market.
Thank you to Ryan Detrick for his contributions to this report.
Burt White is chief investment officer at LPL Financial.