We see enough factors supporting gold to justify a modest allocation in suitable portfolios. Gold is a difficult investment to forecast because of its many performance drivers and the dynamic nature of those drivers. But several relationships seem to hold over time; here we discuss those factors and make a case for maintaining some gold exposure in portfolios for the current macroeconomic environment. Despite the commodity’s 20% gain so far in 2016, gold may continue to shine and additional gains may lie ahead.
Gold’s Dynamic Drivers
At a high level, we see four primary drivers of gold prices: currency movements, inflation expectations, safe haven demand, and jewelry demand. We believe these factors capture the majority of the commodity’s price movements. In analyzing these indicators today, we see several positives:
· The dollar’s transition to a period of stability
· Low interest rates and a likely gradual Federal Reserve (Fed) tightening cycle
· Policy risks, both domestic and overseas
· Rising inflation
· Bullish technical analysis indicators
At the same time, gold faces several headwinds:
· Impending Fed rate hikes and potential stimulus overseas that may lift the dollar
· Potentially overly bullish gold sentiment
· Weak jewelry demand
Gold as a currency?
Perhaps the most widely cited gold driver is its role as a currency substitute. Given that gold is priced in dollars globally, when the dollar rises gold becomes more expensive, and vice versa. As noted in our Outlook 2016 publication, we have expected the dollar to stabilize after its big increase between mid-2014 and mid-2015. Since we issued that forecast in November 2015, as the market has pulled back some on expectations for Fed rate hikes this year, the dollar has moved modestly lower and supported gold even more than we had anticipated [Figure 1].
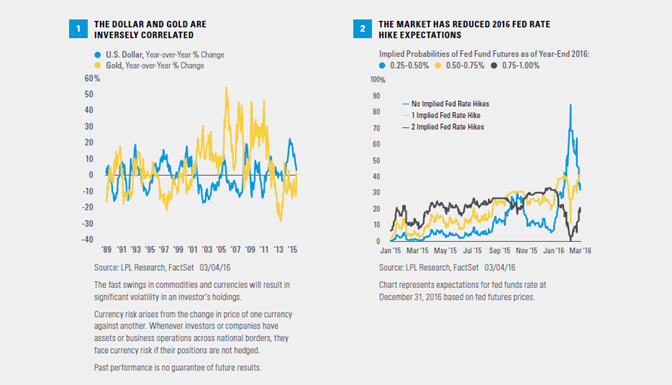
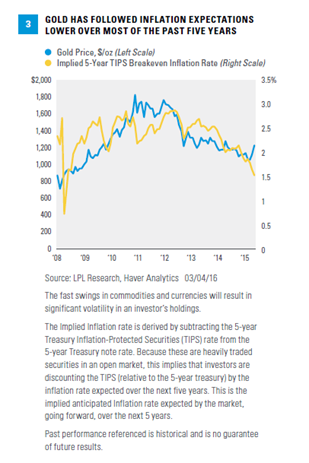
But rate hike expectations may have swung too far to the dovish side, with the fed funds futures market pricing in a 73% chance of no more than one hike in 2016 [Figure 2], despite the strong February jobs report (released March 4, 2016). Should the market begin to price in more rate hikes this year (or increase the probability of at least one hike), the dollar may garner additional support.
The monetary policy of other nations also influences the value of the dollar globally, a factor that may mitigate any potential dollar weakness. The European Central Bank (ECB) may cut its policy interest rate at its March 10 policy meeting (further into negative territory) and/or announce additional asset purchases, i.e., more quantitative easing (QE). The Bank of Japan (BOJ) is likely to do more as well. (See our Weekly Economic Commentary, “From Headwind to Tailwind?” for our detailed views on the dollar.)
Gold may get some support from a stable or possibly even a slightly weaker dollar, but a resilient U.S. economy suggests only marginal declines as the Fed continues with its rate hike campaign.
Gold as an inflation hedge
Inflation is another important gold driver. The biggest increases in gold prices over the past five decades came during the inflation spikes in the late 1970s before Fed Chairman Paul Volcker famously broke the back of inflation in the early 1980s. Double-digit increases in the Consumer Price Index (CPI) measure of inflation in the late 1970s and into 1980 were accompanied by a shocking quadrupling of gold prices from December 1978 through January 1980, from below $200 to over $800.
Today, overall inflation remains in check, but commodity/goods inflation may be poised to make a comeback (as we discussed in our Weekly Economic Commentary, “Too Soon for March Madness?”). Over the past two years, prices of services in the economy (as measured by the CPI for services, representing two-thirds of overall CPI) have settled into a range of 2–2.5%.
But the CPI for goods (prices of oil and other commodities purchased by consumers, accounting for one-third of overall CPI) sank along with oil prices from mid-2014 through early 2016. As a result, by January 2016 the overall CPI was just 1.4%, after dipping as low as -0.2% in mid-2015. Looking ahead to the remainder of 2016, if oil prices rise as we expect, the goods portion of CPI may increase by 2–3%; and if the pace of service sector inflation remains between 2% and 2.5%, overall CPI could accelerate quickly to well over 2.0% by year-end.
This possible inflation upside surprise for the market may provide a boost for gold. Since the Great Recession, gold has responded to changing inflation expectations, including declines during most of the past five years [Figure 3]. The latest rally in gold prices may be an early indication of a regime shift to a more gold-friendly, rising inflation environment (note that a falling dollar and demand from emerging market countries were bigger drivers during the strong 2003–08 period for gold than inflation expectations). Even though U.S. monetary policy is tightening, market-based measures of inflation expectations are probably too low given the aging business cycle and potential for oil prices to rise.
Gold As A Potential Safe Haven
Gold has traditionally played the role of a potential safe haven, which may be its most appealing quality in the current market environment.
U.S. Treasuries have historically been the first place investors go when financial conditions deteriorate. But with interest rates so low (the 10-year Treasury yield is at 1.88% and many countries are much lower than that), gold may be a relatively more attractive alternative. Some of the best periods for gold in recent years have come at lower interest rate levels, corresponding with the market’s increased risk aversion. For example, in 2012 at the interest rate lows of the current economic cycle, when the 10-year yield briefly dipped below 1.5% and the S&P 500 experienced a 10% correction, gold jumped 17% between May 16 and October 4, 2012. January 2016 provides a more recent example, when gold jumped 5%, the 10-year Treasury yield fell 35 basis points to below 2%, and the S&P 500 fell by 5%.
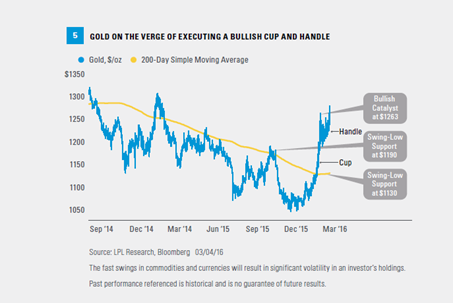
This competition with bonds as a potential safe haven is one of the reasons why gold has historically performed better when short-term real (adjusted for inflation) interest rates have been low. Gold does not have any yield, so there is an opportunity cost to hold it. We measure that cost via short-term real yields, measured by 3-month T-bill yields adjusted for inflation based on annual CPI changes. Gold has historically performed better at low (including negative) short-term real interest rates [Figure 4]. During the past 40 years, gold has risen 10%, on average, over rolling 12-months periods when short-term real interest rates were below zero, compared to an average 2% gain when real interest rates were positive.
Gold may also benefit from safe haven demand related to policy risks. Two broad policy risks stand out that could be potential catalysts for safe haven demand for gold: the possibility of a mistake by the Fed, and policy risks related to the election, especially related to trade policy. Looking at the Fed, with the job market strengthening and inflation beginning to normalize, the potential for a policy mistake has increased, even if the odds remain low. On the political front, more protectionist rhetoric coming from the leading candidates of both parties (and one in particular) increases the odds, even if low, of a trade war that could benefit gold. Additionally, given stock investors’ dislike for uncertainty, gold may be well supported until the nominees are set. Finally, a policy mistake could also be made by China, the U.K. (“Brexit”), Russia, or a number of other foreign countries that could have ripple effects in the U.S. and drive safe haven gold purchases.
Gold and U.S. Treasuries may be considered “safe haven” investments but do carry some degree of risk. Fast price swings in gold can result in significant 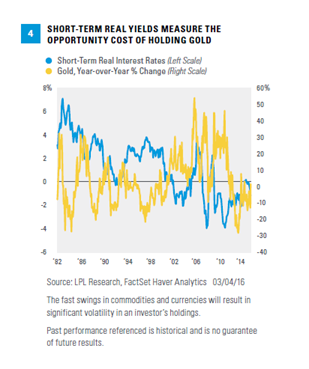
Gold As Jewelry
Jewelry composes more than half of all global gold demand, according to the World Gold Council, and therefore, is an important piece of the overall gold picture. In 2015, jewelry-related gold demand was lackluster, falling 3% versus 2014. The global jewelry market did show signs of improvement in the second half of the year, including strength in India, one of the biggest gold jewelry markets in the world, and growth in the U.S. However, the total global market continues to face headwinds with lackluster demand in Europe, a mixed picture across Asia, and weakness, not surprisingly, in oil-sensitive areas in Russia and the Middle East. Jewelry demand may stabilize in 2016, but at this point we would consider it a slight headwind for the near-term gold outlook.
Technical Outlook
Gold’s technical picture is positive, in our view. Its price has been operating in a daily upward sloping trend and may be close to executing what is known as a bullish cup and handle pattern [Figure 5]. A bullish breakout would take place when gold’s price closes back above the handle, in this case at $1,263; this would increase the likelihood for a continued move higher, targeting a price objective at $1,350 over a six- to nine-month time horizon. Conversely, a closing price below the swing-low level at $1,190 would increase the likelihood of a false signal and increase the probability of a continued move lower, targeting support at the 200-day simple moving average at $1,130.
Interestingly, on a long-term chart gold has retraced about half of its bull market run of the 2000s, indicating the long-term bull market remains intact. Considering gold is coming off of its biggest three-year loss (2013–15) in over 40 years and the commodity has underperformed the S&P 500 by more than 100 percentage points since its August 2011 peak, the upside potential looks attractive.
We also look at sentiment measures to gauge the possible next move for gold from a technical perspective. One way to do that is to use the Commitment of Traders (COT) data for the gold futures market. On that measure, which shows the ratio of buyers versus sellers in that market, both commercial buyers and speculative (financial) buyers are net long, which indicates a potentially overbought situation. In addition, a variety of surveys cited by Ned Davis Research point to a high level of gold optimism.
Conclusion
When analyzing the key drivers of gold prices, we see more positives than negatives. Rising inflation, increasing policy risk, the likely gradual path of Fed rate hikes (which may keep the dollar stable), negative short-term real interest rates, and a positive technical picture all suggest renewed potential gains for gold. But gold faces headwinds in the form of potential additional dollar strength from impending Fed rate hikes, signs of overly optimistic sentiment, and soft jewelry demand. We believe the positives may outweigh the negatives and that a modest gold allocation makes sense for suitable investors as additional gains may lie ahead.
Burt White is chief investment officer for LPL Financial.
Jeffrey Buchbinder, CFA, is market strategist at LPL Financial.