Shelter From the Storm
The Extended Forecast
Your local TV news team has talked about nothing else for the last few days. Temperatures are dropping. Humidity levels are increasing. It's most likely going to snow.
Similarly, the cool air we feel before an interest-rate storm is beginning to blow. Investors who don't consider the possible impact of rising interest rates today may find themselves caught off guard as interest rates normalize in 2018 and beyond. FIGURE 1 illustrates how rising interest rates could impact your fixed-income investments.
FIGURE 1
Hypothetical Impact of Rising Rates on Fixed Income
Price impact of 1% rise in interest rates1
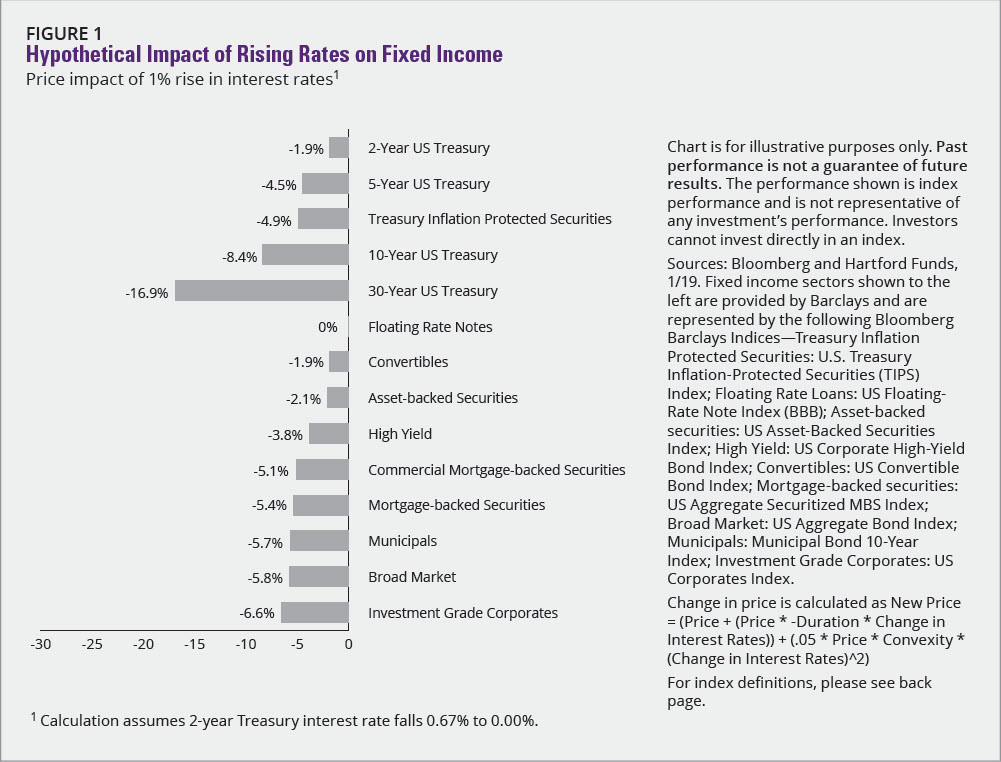
Chart is for illustrative purposes only. Past performance is not a guarantee of future results. The performance shown is index performance and is not representative of any investment's performance. Investors cannot invest directly in an index.
Source: Bloomberg Barclays, 12/17. Fixed income sectors shown to the right are provided by Barclays and are represented by the following Bloomberg Barclays Indices—Treasury Inflation Protected Securities: U.S. Treasury Inflation-Protected Securities (TIPS) Index; Floating Rate Loans: US Floating-Rate Note Index (BBB); Asset-backed securities: US Asset-Backed Securities Index; High Yield: US Corporate High-Yield Bond Index; Convertibles: US Convertible Bond Index; Mortgage-backed securities: US Aggregate Securitized MBS Index; Broad Market: US Aggregate Bond Index; Municipals: Municipal Bond 10-Year Index; Investment Grade Corporates: US Corporates Index
Change in price is calculated as New Price = (Price + (Price * Duration * Change in Interest Rates))+(.05 * Price * Convexity * (Change in Interest Rates)^2)
The US Federal Reserve (Fed) kept the federal funds rate, the interest rate at which banks and credit unions lend reserve balances to other depository institutions overnight, low to kickstart growth after the recession. Interest rates are calculated on that rate. After nearly a decade with interest rates near zero, they began going back up in 2015 as the Fed started to raise their target rate. The Fed is currently projected to raise its target rate twice in 2018 (FIGURE 2). Rates could rise more quickly if economic growth exceeds expectation and/or if wages, and ultimately, inflation, rise more quickly than forecast. If predictions of nearly 4% global economic growth for 2018 are correct, interest rates may increase more than expected.2
FIGURE 2
Recent and Projected Fed Rate Hikes

*Includes projections as of February 2018
Sources: bloomberg.com and federalreserve.gov
Checking the Barometer
A barometer—a tool meteorologists use to measure air pressure—can give a solid indication of changing weather patterns. A rising reading indicates a clear and sunny day while a falling one suggests cloudy and wet conditions. Similar to a barometer, the duration of the Bloomberg Barclays US Aggregate Bond Index is a helpful indicator of coming change. Duration, which is expressed in years, measures how much a bond's price might rise or fall when interest rates change. The longer the duration, the greater the bond's sensitivity to a change in interest rates (FIGURE 3).
FIGURE 3
Duration Risk Is Rising: Are You Prepared?
Duration of the Bloomberg Barclays US Aggregate Bond Index
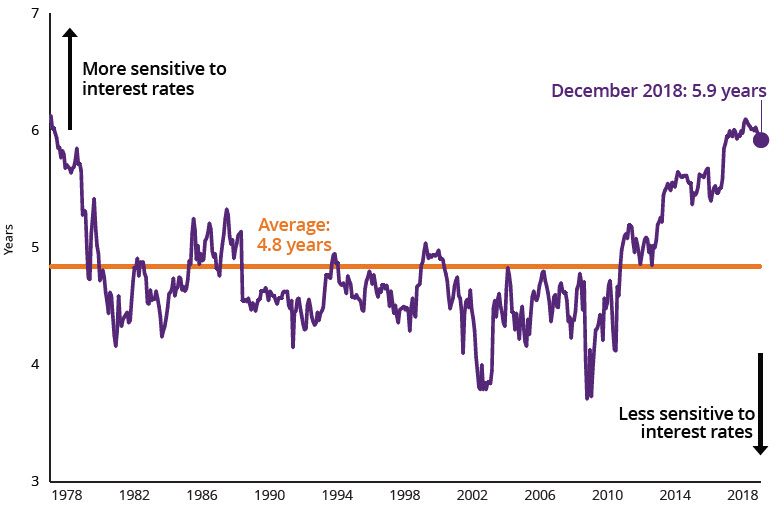
Source: Barclays Live, 12/17. For illustrative purposes only.
In September 2017, the duration of the Bloomberg Barclays US Aggregate Bond Index exceeded six years for the first time since the late 1970s. That means an investment with a duration of six years could lose up to 6% if interest rates increase by 1%. For example, an investment of $100,000 would end up being worth $94,000.
More Extreme Weather Ahead?
The winter of 2013-2014 was one the of coldest and snowiest winters in the past 25 years. Snowfalls approached all-time record highs in many major metropolitan areas across the country, and many cities in the Northeast experienced snowfalls that were 200-300% higher than average.3
Likewise, we've seen the impact a 1% hike in interest rates has on core bonds intensify, too. Fixed-income investors historically weathered that 1% increase while still bringing home a return. In today's markets, the same rate increase could potentially offset any pickup in yield, resulting in a loss (FIGURE 4).
FIGURE 4
Core Bonds May Provide Less of a Cushion Against Rising Rates
Impact of a 1% Interest-Rate Increase on Core Bonds (12/31/17)
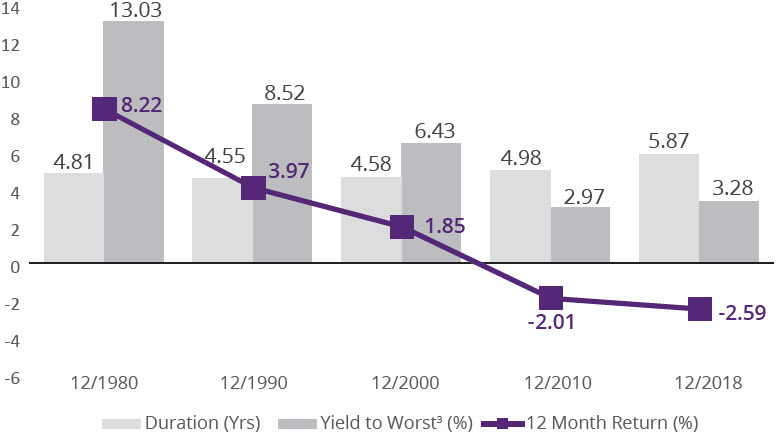
Source: FactSet, Data Calculation: Hartford Funds. 12/17. Core bonds are represented by the Bloomberg Barclays US Aggregate Bond Index. For illustrative purposes only.
That 1% increase could hurt more now than in the past because the duration of bonds has slowly risen as yields have dropped steadily. Back in 1980, an investor would have still seen a return greater than 8% over the following 12 months because the average yield on a core bond fund was more than 13%. Today, with the average yield below 3%, that 1% increase would create a negative return of -3.41% on a typical core bond fund.
It's All Connected
Volatile weather patterns we see on the other side of the planet may wind up influencing the weather that's forecasted for your neighborhood. The same is true in financial markets.
Fixed-income investing may also be impacted if equity markets show signs of greater volatility. The VIX, or the Chicago Board Options Exchange (CBOE) Volatility Index, is a key measure of near-term volatility for the S&P 500 Index—a common benchmark for US stocks. The VIX is currently at historic lows (FIGURE 5). As it heads higher, history suggests the S&P 500 Index, a market capitalization-weighted price index composed of 500 widely held common stocks, could lose momentum. If the companies represented by that index lose steam, it may have an impact on the bonds they've issued.
FIGURE 5
VIX and S&P 500 Index Are Negatively Correlated
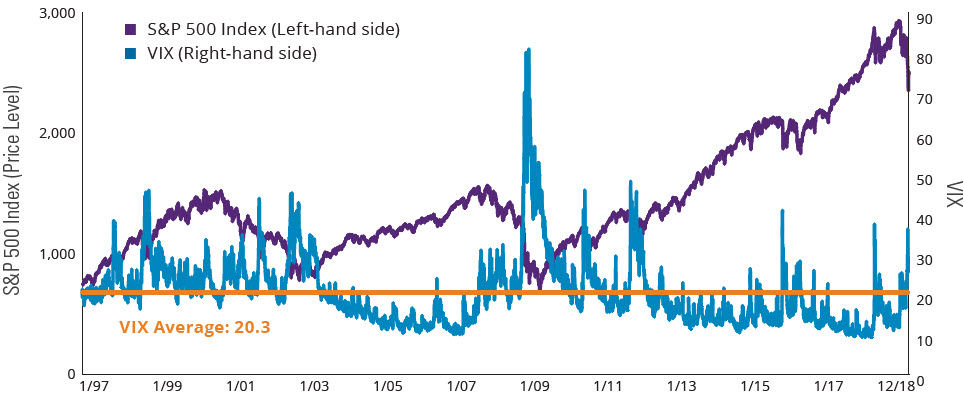
VIX levels below 20 reflect complacency, while levels of 40 or higher reflect extremely high levels of volatility.
Past performance does not guarantee future results. Indices are unmanaged and not available for direct investment.
Source: Morningstar, 12/17.
Winter Is Coming
Snowbirds, those who flee southward from colder climates, attempt to avoid snow. But despite their best attempts to avoid it, they often just find different wet weather in warmer areas. Likewise, investors who seek yield in other areas may run into bad conditions. The income-generating fixed income that has produced the highest yield is also the type that may see the biggest impact if the S&P 500 Index starts to decline. Because income-generating fixed income is so highly correlated to the S&P 500 Index, their prices are likely to decline when the Index declines (FIGURE 6).
Investors may want to consider reallocating to fixed-income sectors that are less correlated to US stocks. These include world bonds, short-term bonds, core bonds, US Treasuries, and investment-grade corporates. These investments yield less, but may be less impacted by changes in S&P 500 Index performance.
FIGURE 6
Fixed Income Can Play Unique Roles in a Portfolio
Historic Equity Correlation vs. Yield (12/31/17)
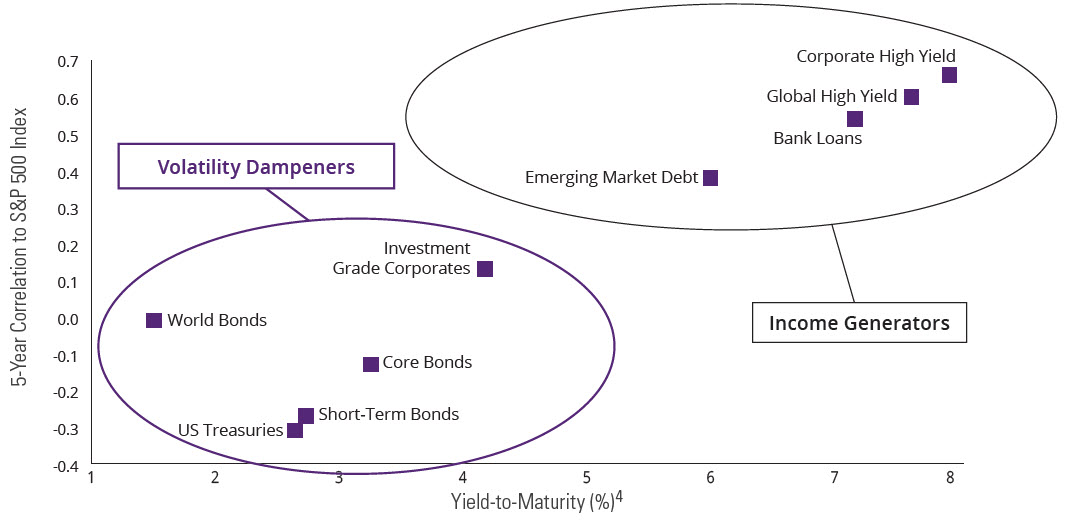
Performance data quoted represents past performance and does not guarantee future results. Asset classes are represented by the following indices: Bank Loans (Credit Suisse Leveraged Loan), Corporate High Yield (Bloomberg Barclays US Corporate High- Yield), Emerging Market Debt (Bloomberg Barclays EM USD Aggregate), Global High Yield (Bloomberg Barclays Global High Yield), Core Bonds (Bloomberg Barclays US Aggregate Bond), Investment Grade Corporates (Bloomberg Barclays US Corporate Investment Grade), Short-Term Bonds (Bloomberg Barclays US Gov't/Credit 1-3 Yr), US Treasuries (Bloomberg Barclays US Treasury 7-10 Yr), World Bonds (Citigroup World Government Bond) Source: Barclays Live, Morningstar, 12/17. For illustrative purposes only.
Your Financial Meteorologist
Just like you wouldn't trade all of your deck furniture for every shovel at the hardware store, you probably don't want to go overboard and do something drastic in preparation. Regardless of rate increases, fixed income should remain a consideration in investor portfolios to help act as a bulwark against equity volatility.
With recent data pointing to new weather patterns for investors, it now begs the question: Is there a middle ground, a smart way someone can prepare for what's ahead? Consider these action steps:
- Examine the duration of your fixed-income portfolio to see how much a 1% rise in rates could impact you
- Be clear on what role your fixed income is playing in your portfolio: volatility dampener vs. income generator
- Examine if you should reduce equity risk within your portfolio (see below)
Now is the time to think about how you can weather the potential whiteout of interest-rate normalization. The storm might be just over the horizon. Will you be ready?
Reducing Risk Within Equities
Although not a substitute for bonds, here are two ways investors can help reduce risk when investing in equities.
1. Low-volatility equities
Lower-volatility stock strategies typically experience less dramatic price changes when the market goes down since fund managers aim for benchmark returns with considerably less risk. Investors who opt for this low-volatility approach maintain the long-term capital appreciation that investors look for in equities—while aiming to reduce risk exposures along the way.
2. Dividend-paying stocks
Dividends have historically played a significant role in total return, particularly when average annual equity returns have been lower than 10% during a decade.6 With interest rates currently at low historical levels, dividend-paying stocks have been appealing to many investors seeking yield. Those searching for income-producing investments may find dividend-paying stocks more attractive than today's lower-yielding bonds.

* For a full list of Hartford Funds, please visit hartfordfunds.com
Past performance is not a guarantee of future results. Other share classes may have different ratings. The Morningstar RatingTM for funds, or "star rating", is calculated for funds and separate accounts with at least a 3-year history. Exchange-traded funds and open-ended mutual funds are considered a single population for comparative purposes. Star rating based on a Morningstar Risk-Adjusted Return measure that accounts for variation in a managed product's monthly excess performance (without adjusting for any sales load, if applicable), placing more emphasis on downward variations and rewarding consistent performance. 5 stars are assigned to the top 10%, 4 stars to the next 22.5%, 3 stars to the next 35%, 2 stars to the next 22.5%, and 1 star to the bottom 10%. Overall Morningstar Rating is derived from a weighted average of the performance figures associated with its 3-, 5-, and 10-year (if applicable) Morningstar Rating metrics. For more information about the Morningstar Fund Ratings, including their methodology, please go to global.morningstar.com/managerdisclosures. © 2018 Morningstar, Inc. All rights reserved. The information contained herein: (1) is proprietary to Morningstar and/ or its content providers; (2) may not be copied or distributed; and (3) is not warranted to be accurate, complete or timely. Neither Morningstar nor its content providers are responsible for any damages or losses arising from any use of this information.
Index data for Citigroup World Government Bond Index © 2018 Citigroup Index LLC ("Citi Index"). All rights reserved. CITI is a trademark and service mark of Citigroup Inc. or its affiliates, is used and registered throughout the world, and is used with permission for certain purposes by Hartford Funds Management Group, Inc. The Hartford World Bond Fund is not sponsored, endorsed, sold or promoted by Citi Index, and Citi Index makes no representation regarding the advisability of investing in such fund. Reproduction of the Citi Index data and information (collectively, "Citi Data") in any form is prohibited except with the prior written permission of Citi Index. CITI INDEX GIVES NO EXPRESS OR IMPLIED WARRANTIES, INCLUDING, BUT NOT LIMITED TO, ANY WARRANTIES OF ACCURACY, ADEQUACY. MERCHANTABILITY OR FITNESS FOR A PARTICULAR PURPOSE OR USE. Citi Index is not responsible for any errors or omissions in, or for the results obtained from use of, Citi Data, and in no event shall Citi Index be liable for any direct, indirect, special or consequential damages in connection therewith.

