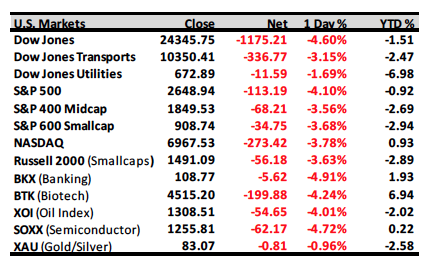
And the headlines read: "Crash Risk Is Soaring: This Is Where They Lost Their Minds," "I expect the S&P 500 to lose approximately two-thirds of its value over the completion of this cycle," "Is the Longest Bull Market Run Nearly Over?" "The Investment With the Most Compelling Case Right Now: Cash." These are unbelievable headlines with the S&P 500 (SPX/2648.94) only ~9 percent off of its intraday high of ~2,873 into yesterday's intraday low! Moreover, we have been telling participants for weeks that early/mid-February was a window of downside vulnerability (to reiterate, our models have a plus or minus three-session timeframe of the exact date). So, the recent selling should have come as no surprise to readers of these missives. As our friend Tony Dwyer, arguably the best thinking strategist on Wall Street, writes:
Corrections only are considered "natural, normal, and healthy" until they actually happen. The next few months that may contain multiple "whooshes and ramps" will be no different. Each will feel like the fundamental backdrop is at risk, only to realize that the tailwinds still exist.
Tony then goes on to explain said tailwinds are still in force and they are solid global growth, accelerating domestic activity, capital spending improvement, incomes that are jumping, and the list goes on. And, then there was this from our pal Leon Tuey:
Currently, investors are gripped by fear, but the market is not yet oversold, but that condition can be reached very quickly. Since the secular trend remains powerfully bullish, investors have been advised to emphasize stock selection and not to be mesmerized by the ups and downs of the S&P. (It doesn't tell investors when to buy or when to sell and what to buy and what to sell.) Therefore, when the market finally gets oversold, many stocks will have taken flight.
Leon then writes:
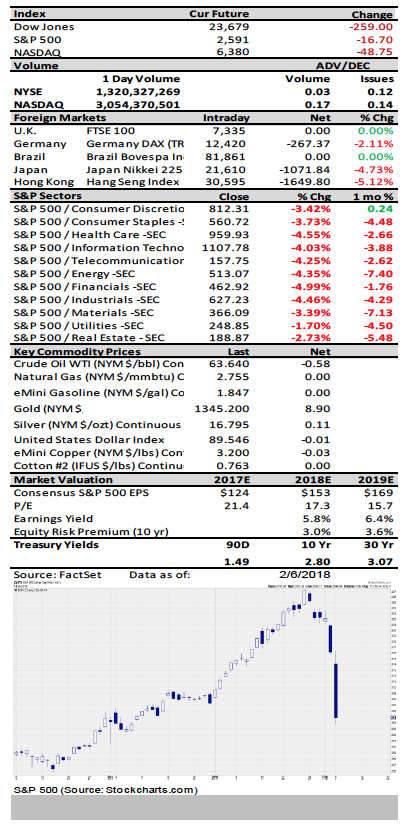
Objectively, take a gander at the weekly chart of the VIX, which is the most popular subject on Wall Street. Note how it spiked this week? Also, note that it shot above the upper Bollinger Band and the CCI is already in overbought territory. What this means is that volatility is overdone. Moreover, take a look at the chart showing the VIX3M vs. the VIX, which plunged sharply to 1.065 on Tuesday. This ratio has an outstanding record of identifying intermediate market bottoms. Note, when it dips below 1.00, it has coincided with correction lows. It doesn't take much for this indicator to drop below 1.00; additional weakness would drive it below 1.00 (see Chart 2). The correction is not surprising as mentioned in my previous reports, because of the overbought condition and the sharp rise in bullish sentiment, the market will likely consolidate/correct. Because of the strong fundamental backdrop and the market's bullish technical structure, my view was that the correction will prove to be more of a time/rotational one and not magnitude. This week, both technical and sentiment factors support this. In conclusion, refrain from joining the crowd. Additional weakness should be viewed as a buying opportunity as the secular trend remains powerfully bullish.
As for us, we think we made a "selling climax low" yesterday and that the subsequent throwback should be sharp. However, while aggressive trading types can attempt to trade the upside, we do not trust it and prefer to "sit on our hands" until things become more clear to us as investors. What should happen here is a throwback rally that fails and then a retest of the recent "lows"; and that should be it on the downside. This morning that looks to be what is happening with the preopening S&P 500 futures up some 14-points as we write at 4:47 a.m. Today is important because in the Monday crashes of 1987 and 1989, we experienced "Turnaround Tuesday" and traders will be watching for that.

Jeffrey D. Saut is chief investment strategist at Raymond James.