History doesn’t repeat, but it rhymes, or so the saying goes. In retrospect, we see many similarities between 2018 and 1994.
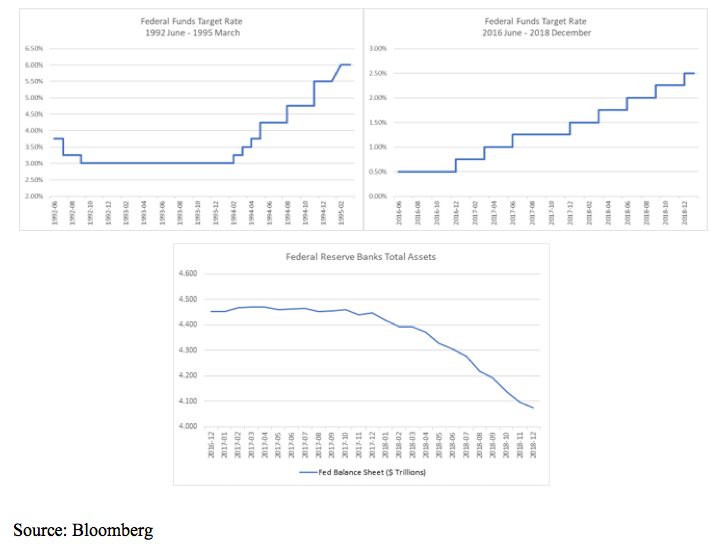
To start, after holding the Federal Funds rate at 3.00 percent since late 1992, in early 1994 the Federal Reserve began a series of interest rate increases. Over the course of the year, the Federal Reserve increased the Federal Funds rate by 2.25 percent. In 2018, the Federal Reserve increased the Federal Funds rate by 1.00 percent, delivering four 25bp rate increases, in excess of the two to three 25bp rate increases expected by most market participants at the start of the year. In addition, the Federal Reserve also reduced its balance sheet by $400 billion, a reduction of roughly 9 percent of the assets held by the Federal Reserve.
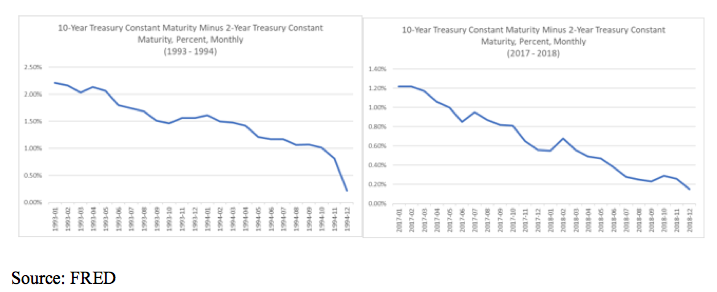
As a result of these Fed policies, the spread differential between longer dated Treasuries and shorter dated Treasuries contracted over the course of both periods, continuing a trend that was already in place.
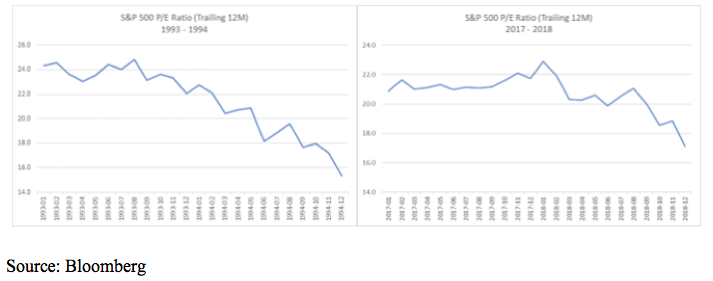
Equity valuations improved (got cheaper) in both periods as prices struggled while earnings grew.
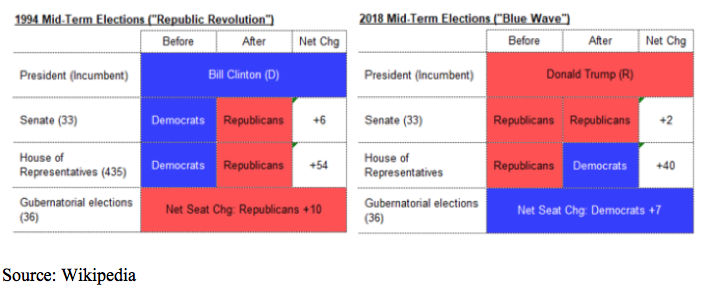
Politically, the United States had mid-term elections during both periods. Prior to each election, both chambers of Congress and the presidency were held by the same party. After each election, at least one chamber of Congress flipped parties resulting in a divided government for the next two years.
Lastly, both years ended with ISM manufacturing that, while still strong in absolute terms, was a sharp decline from the readings seen in the prior months.

In the face of a tightening Federal Reserve, a flattening yield curve, a divided government and a slow down in the outlook for manufacturing, how did the equity market perform in 1995? The S&P 500 was up 37.5 percent in 1995 and up 31.1 percent annually over the next three years.
How did this happen? There were a few catalysts that, when combined, produced an excellent environment for equity investors. First, the Federal Reserve ended their hiking cycle in early 1995 and cut interest rates twice that year, in August and in December as economic data softened. The ISM Manufacturing survey continued to decline in 1995 and was below 50 from May 1995 through May 1996. YoY GDP growth declined from over 4 percent at the end of 1994 to 2.2 percent at the end of 1995. Second, 1995 was the start of an increase in average hourly earnings for production and non-supervisory employees. On average, wages grew 2.5 percent YoY in 1993 and 1994. By the end of 1995 wages were growing 3.0 percent YoY, and by mid-1998 wages were growing 4.3 percent YoY. Third, EPS for the S&P 500 index increased by 46 percent over the next three years. Lastly, equity valuations had declined by over 35 percent by the end of 1994, equities were more attractive on a valuation basis than at any point in the prior two years.
So, what does this mean for 2019? Equities entered 2019 on a tough footing after a brutal Q4. The S&P 500 finished the quarter down 13.5 percent but was down 18.9 percent at the depth of the market sell-off in December. However, as a result of last quarter, the S&P 500 ended 2018 at its cheapest level since early 2014. We may not see the same level of GDP growth as we did in 2018, however YoY wage growth just increased by 3.3 percent in the most recent Nonfarm Payroll Report for December 2018. Further, YoY wage growth has steadily increased since the beginning of 2018 even though the U.S. added more workers in 2018 (2.6 million) than in either of the prior two years. Relative to just a few months ago, Chairman Powell and the Federal Reserve have appeared to take a more dovish approach to both their interest rate policy path and balance sheet run-off policy. By exercising maximum optionality, the Federal Reserve can appropriately respond to the incoming data without any prior constraints, much like they did in 1995. While these factors are positive for an equity investor, given the level of bearish sentiment in the market currently we probably need a few more catalysts to lift equities over the current wall of worry. Perhaps it’s more easing out of China (the PBOC has already reduced its reserve requirement a few times, most recently on January 4th). Maybe a resolution to the U.S./China trade dispute. Possibly something out of Europe as a result of the Italian election and/or the yellow vest protests in France? Whatever that catalyst may be, given where equities are priced now, the ex-ante distribution of returns is probably more positively skewed than not.
Even if all the known risks in the world are not resolved or new risks emerge, it doesn’t mean equities cannot rally. It’s not like 1995 was all flowers and lovesongs…

Tim Rudderow is the president & CIO of Mount Lucas Management, overseeing all activities. Kent Huang, CFA, FRM is the chief risk officer at Mount Lucas Management.