KEY TAKEAWAYS
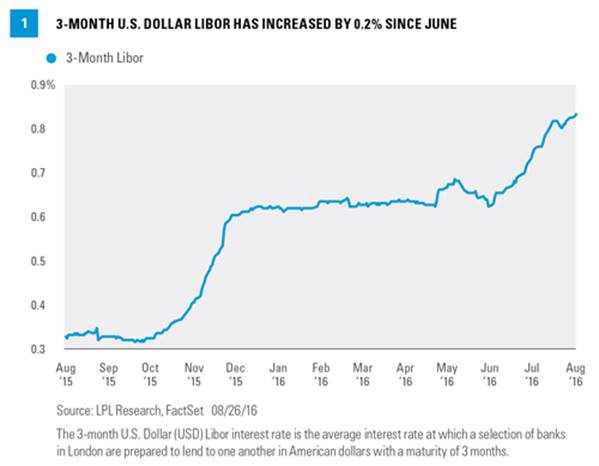
• 3-month U.S. dollar Libor has increased by 0.2% over the past two months, which carries almost the same impact as a full rate hike, even though the Fed has not raised rates since December 2015.
• Investors in bank loans may benefit if Libor continues to rise, given that the floating rates may start to move higher once the 1% Libor floor that many issues carry is exceeded.
• Major drivers of the increase in Libor include money market reform, regulation-driven Libor calculation changes, demand for U.S. dollars in foreign exchange markets, and an assist from Fed rate hike expectations.
Libor has been on the rise in recent weeks and for many borrowers, the increase is almost equivalent to a Federal Reserve (Fed) rate hike. The London Interbank Offered Rate (commonly known as Libor) is a commonly used short-term interest rate benchmark. In addition to a measure of interbank lending rates, Libor is used as a reference rate on an estimated $350 trillion of bonds and debt contracts worldwide, including adjustable rate mortgages and floating rate bonds (known as bank loans).
Figure 1 shows that the last significant increase in 3-month U.S. dollar Libor was in late 2015, when the rate jumped by 0.31%, driven by a Federal Reserve (Fed) rate hike. Libor has increased by approximately 0.2% over the past two months; this time without the help of a Fed rate hike, leaving many wondering what is behind the rise. We will examine several potential reasons for the increase, determining which are likely, and which aren’t.
BANK FEARS ARE NOT A DRIVER
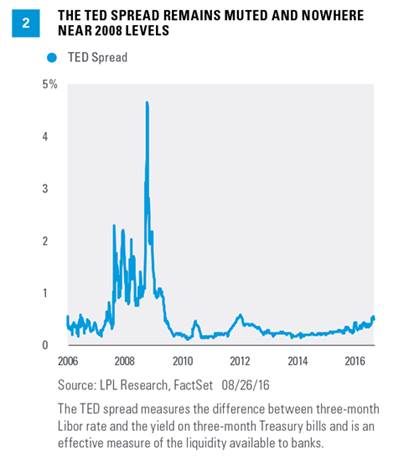
For many, the rise in Libor brings back memories of the 2008 financial crisis, when banks became fearful of lending to one another, leading to an increase in the rates they charged each other for short-term loans. Recent headlines surrounding Brexit, Italian bank fears, and other scary headlines have no doubt amplified concerns that bank weakness may be driving Libor higher. However, a look at the TED spread (3-month Libor minus the 3-month Treasury yield [Figure 2]), a measure of interbank lending fears that gained notoriety during the financial crisis, shows that the recent increase (driven by the rise in Libor) is nowhere near what was experienced in 2008.
Other measures of bank stress, such as credit default swap (CDS) spreads for banks, which reflect the cost of insuring against default, have come down from post-Brexit levels and do not suggest the presence of bank solvency fears. Stronger balance sheets (especially in the U.S.) and supportive policy from global central banks (in Europe and Japan) may also act as a tailwind for banks, potentially reducing the risks of systematic problems like those seen in 2008.
MONEY MARKET REFORM IS A MAJOR DRIVER
Money market reform is a more likely driver of the increase in Libor. New rules for money market funds (MMFs) will go into effect on October 14, 2016. Among the most important, prime MMFs will move to a floating net asset value (NAV), while government MMFs will be allowed to retain the existing fixed NAV of $1.00. This decision has led institutional investors to sell approximately $293 billion of prime money market holdings year to date (according to ICI data), with approximately $280 billion moving into government MMFs. This movement is decreasing demand for common holdings of prime money markets, such as commercial paper and CDs, leading to higher rates for short-term instruments that influence Libor.
An investment in a money market fund is not insured or guaranteed by the Federal Deposit Insurance Corporation or any other government agency. Although the Fed seeks to preserve the value of your investments at $1.00 per share, it is possible to lose money investing in the fund.
FOREIGN DEMAND FOR DOLLARS
At least a portion of the rise in Libor is, counterintuitively, related to negative rates in other parts of the world. U.S. Treasury yields, while near all-time lows, remain attractive relative to the negative yields on foreign government bonds. This has driven overseas demand, but in order to purchase Treasuries or other dollar based assets, foreign investors first must purchase dollars in foreign exchange markets. Foreign demand for dollars has pushed funding costs higher, putting upward pressure on U.S. dollar Libor.
The Fed, however, maintains dollar liquidity arrangements with other major central banks, allowing them to borrow dollars if market supply becomes too tight. Currency swap arrangements between the Fed and global central banks may therefore act as a cap to the rise in Libor. If Libor climbs too high, market participants may be able to borrow from a central bank. These liquidity provisions are likely helping to weaken the upward pressure that dollar funding is putting on Libor, though other drivers remain in place.
FED RATE HIKE EXPECTATIONS ARE PART OF THE PUZZLE
The last major move in Libor, in late 2015, was driven by a Fed rate hike. Expectations for a rate hike have been increasing recently, with fed fund futures putting the chance of a rate hike at the Fed’s December 2016 meeting at 54%. The Overnight Indexed Swap Rate tends to track rate hike expectations, and as Figure 3 shows, this measure has increased by 11 basis points (0.11%) since June 2016, though about half of this increase has come in the past two weeks, while Libor has been on a steadier upward trend. Changing rate hike expectations have played a role in the rise of Libor, but account for only about half of the increase.
POTENTIAL INVESTMENT IMPLICATIONS: BANK LOANS AND INVESTMENT GRADE CORPORATES
A major advantage of bank loans is their floating rates, which allow holders to receive higher interest payments as rates rise. The interest paid is generally determined by a specified spread above Libor, but approximately 92% of the bank loan market (based on the S&P/LSTA U.S. Leveraged Loan Index) has a Libor floor. Though floor rates can vary by issue, the average is 1%. Libor has been below this floor rate for some time, so investors haven’t benefited from the rise in Libor so far.
A small segment of the corporate bond market also pays interest income tied to Libor, and investors in money market instruments, such as commercial paper, the corporate equivalent of a Treasury bill, have been benefiting. The average yield on 90-day AA-rated financial company commercial paper is 0.75% as of August 29, 2016, according to Fed data. The average yield held at roughly 0.55% through June 2016 before matching the recent increase in 3-month U.S. Libor.
Floating rate bank loans are loans issues by below-investment-grade companies for short-term funding purposes, with higher yield than short-term debt, and involve risk. These Lower-quality debt securities involve greater risk of default or price changes due to potential changes in the credit quality of the issuer.
CONCLUSION
There are several potential drivers of the recent rise in Libor, though banking fears are not one of them. It remains to be seen if the increase will stick, but if Libor starts to drop following the implementation of money market reform in mid-October 2016, it may be a sign that the increase was a transient event. However, if rates don’t fall, or at least reconnect with Fed rate hike expectations, it may be an indication that benchmark regulations are a more important driver. Such a structural change would be more likely to persist and may have a greater impact on financial markets, especially for those who hold adjustable rate products such as floating rate bonds or for those who carry adjustable rate mortgages.
Anthony Valeri is fixed-income and investment strategist for LPL Financial.


