


Investors are facing important questions about their future in today’s investing climate. What is a safe withdrawal rate? What are reasonable return expectations for our portfolios? Let’s introduce a framework for these questions.
Over the last 50 years, U.S. equities have averaged annual returns of 10.56%. U.S. bonds averaged 7.43%. A U.S. portfolio of 70% equities and 30% bonds, rebalanced annually, would have averaged 10.03%. Importantly, if you add 70% of the return of the equities and 30% of the return of bonds, the result is not 10.03%. It is 9.62%. The 70/30 portfolio experienced a 0.41% bump with what is called “diversification return.”
In 1992 David Booth and Eugene Fama published “Diversification Returns and Asset Contributions,” in which they found, “The portfolio compound return is greater than the weighted average of the compound returns on the assets in the portfolio. The incremental return is due to diversification.”
This is the free lunch in investing. Diversification return occurs because of two factors. The first has to do with the math of a portfolio recovering from a loss—it needs to rise by a higher percentage than it lost to even out. A portfolio that declines 25% needs to rise 33% to break even. A portfolio that declines 50% needs to rise 100%. Decreasing a down period with non-correlated assets means future returns do not have to be so high.
The second factor is rebalancing, or the process of selling higher and buying lower over time. These two factors add diversification return in any sensible strategy over the long term. The more diversification you have in your portfolio, the higher your diversification return.
So how can one assess the reasonable expectations from their portfolio going forward? Valuation matters.
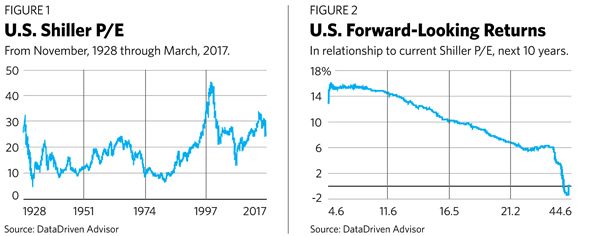
To understand this better, we need to look at the predictive power of the Shiller valuation (Figure 1).
Figure 1 shows the historical Shiller P/E for the S&P 500. High numbers imply an expensive market, low numbers a cheap market.
The chart on the right (Figure 2) displays the historical relationship between the current Shiller P/E and the average returns over the next 10 years. This data is over 90% correlated, and while some individual periods have varied from the forecast, this is generally an excellent indication of future returns. Since the forecast is medium to long term, some people get hung up on the timing. But this is as good an indicator of rational expectations as we have, and everyone is planning for the medium to long term, so our forecasts should align with the time line. Notice how when the Shiller P/E is low, high returns generally follow. Of course, it follows that when the Shiller P/E is high, low returns tend to follow.