Investors are facing important questions about their future in today’s investing climate. What is a safe withdrawal rate? What are reasonable return expectations for our portfolios? Let’s introduce a framework for these questions.
Over the last 50 years, U.S. equities have averaged annual returns of 10.56%. U.S. bonds averaged 7.43%. A 70/30 U.S. portfolio, rebalanced annually, would have averaged 10.03%. Importantly, if you add 70% of the return of the equites and 30% of the return of bonds, the result is not 10.03%. It is 9.62%. The 70/30 portfolio experienced a 0.41% bump due to what is called “diversification return.”
In 1992 David Booth and Eugene Fama published “Diversification Returns and Asset Contributions”. Their summation?
“The portfolio compound return is greater than the weighted average of the compound returns on the assets in the portfolio. The incremental return is due to diversification.”
This is the free lunch in investing. Diversification return occurs due to two factors. The first has to do with the math of a portfolio recovering from a loss--it needs to rise by a higher percentage than it lost to even out. A portfolio that declines 25% needs to rise 33% to break even. A portfolio that declines 50% needs to rise 100%. Decreasing a down period with non-correlated assets means future returns do not have to be so high.
The second factor is rebalancing, or the process of selling higher and buying lower over time. These two factors add diversification return in any sensible strategy over the long term. The more diversification you have in your portfolio, the higher your diversification return.
So, how can one assess the reasonable expectations from their portfolio going forward?
Valuation matters.
To understand this better, we need to look at the predictive power of Shiller valuation.
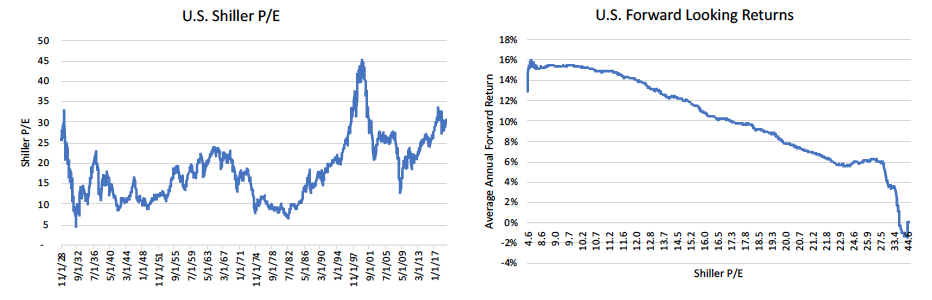
Above is a chart showing the historical Shiller P/E for the S&P 500. High numbers imply an expensive market, low numbers a cheap market.
The chart to the right displays the historical relationship between the current Shiller P/E and the average returns over the next ten years. This data is over 90% correlated, and while some individual periods have varied from the forecast, this is generally an excellent indication of future returns. Since the forecast is medium-to-long term, some people get hung up on the timing. But this is as good an indicator of rational expectations as we have and everyone is planning for the medium-to-long term, so our forecasts should align with the timeline. Notice how when the Shiller P/E is low, high returns generally follow. Of course, it follows that when the Shiller P/E is high, low returns tend to follow.
How can we use this data? Since the Shiller P/E was 31 at the end of 2019, let’s transport ourselves back in time to the last time the Shiller P/E was around 31 at the end of a year, or December of 2001. At that time the 10-Year U.S. bond yielded 5.07%. It would have been reasonable for an investor to expect around 5.07% from their bonds. And their stocks? The Shiller P/E of 31 was over two standard deviations above median, implying 3.10% average annual returns going forward.
We could have said, “I expect 3.10% from my stock portfolio and 5.07% from my bond portfolio”. The math on expectations of a 70/30 portfolio would have been: .70%*3.10% + .30%*5.07% = 3.69%.
Note that the diversification return is generally smaller for shorter time periods, so we would add in 0.30% for diversification return (0.30% was the median diversification return for a 70/30 portfolio over 10-year periods as of 12/31/2001). We could have expected 3.99% average annual returns. Over the next decade, the returns of a 70/30 portfolio were 4.96%, or pretty close to expectations and certainly far under the long term returns of the 70/30 portfolio (which had been 11.36% at that time!). Anyone expecting to obtain the average long-term returns would have been badly disappointed.
Below we can see the complete historical data set since 1970. This indicates what led to the expectations for a 70/30 portfolio for each year since 1970. The far right column shows how far off the expectations were from the actual experience.
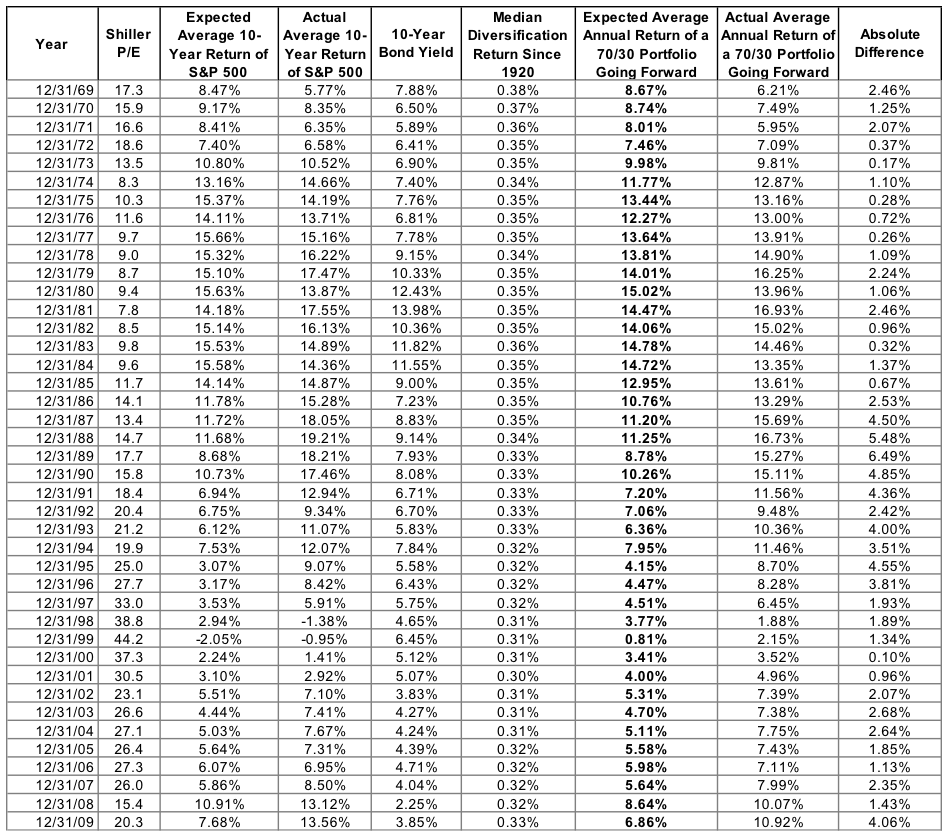
Expected returns have been between 1% and 15% while actual returns have been between 2% and 17%. Over a decade, returns face an uncomfortably wide range of outcomes, and that range depends almost entirely on starting valuation. Note that 76% of the time, expected returns fell within 3% of actual returns. Further, the times where results were off by more than 3% were all associated with the outperformance due to the internet bubble and the period ending 2019 (the longest bull market on record).
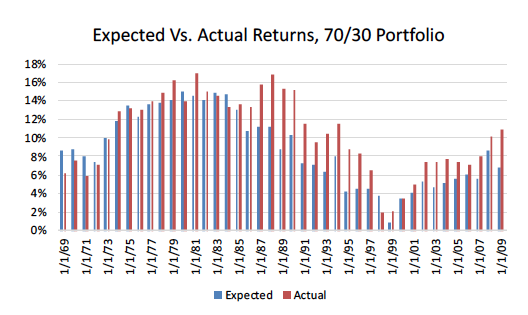
To better show the data, below is a graph of the expected and actual returns going forward, by year. The data is over 85% correlated.
Where We Are Today
Starting this year the 10-year U.S. government bond was yielding 1.92%. The Shiller P/E of 31 is almost 2 standard deviations above median. This valuation implies 3.55% average annual returns going forward for U.S. equities. Today the math on expectations of a 70/30 portfolio should be: .70%*3.55% + .30%*1.92% = 3.06%.
Add in 0.35% for diversification return (the long-term average, as of today), and expectations should be 3.41% for a U.S. 70/30 portfolio going forward. Using the same methodology, the Shiller P/E forecast for average annual returns over the next seven years is an even more disappointing 1.80%.
3.41% is likely not enough for most investors, especially considering that after deducting inflation the real return is even lower. So, what can we do? Diversify.
Over the last 50 years, a diversified portfolio averaged 9.59%. Importantly the diversification return averaged 1.12% annually! This is a huge bump in today’s low expectations environment. Recall, the more diversification you have, the higher your average diversification return.
We’ve already set our expectations for U.S. stocks and bonds at 3.55% and 1.92%. Let’s look at the other pieces of the diversified portfolio.
Start with international bonds. A large international bond fund, ticker BWX, has a 30-day sec yield of 0.67%. A large emerging market bond fund, ticker EMLC, has a 30-day SEC yield of 5.09%. For international bonds in total, we’ll make a rough assumption of 70% in developed and 30% in emerging markets. We should expect a return of .70%*0.67 + .30*5.09 = 2.00% on our international bonds.
While this is similar to our U.S. bond expectations, there is a diversification element provided by holding international currencies. If the U.S. dollar depreciates, these bonds might do well. Of course, the reverse holds true if the dollar appreciates.
How about international stocks? Look at valuations for the four largest developed countries: Japan, Germany, the U.K. and France.
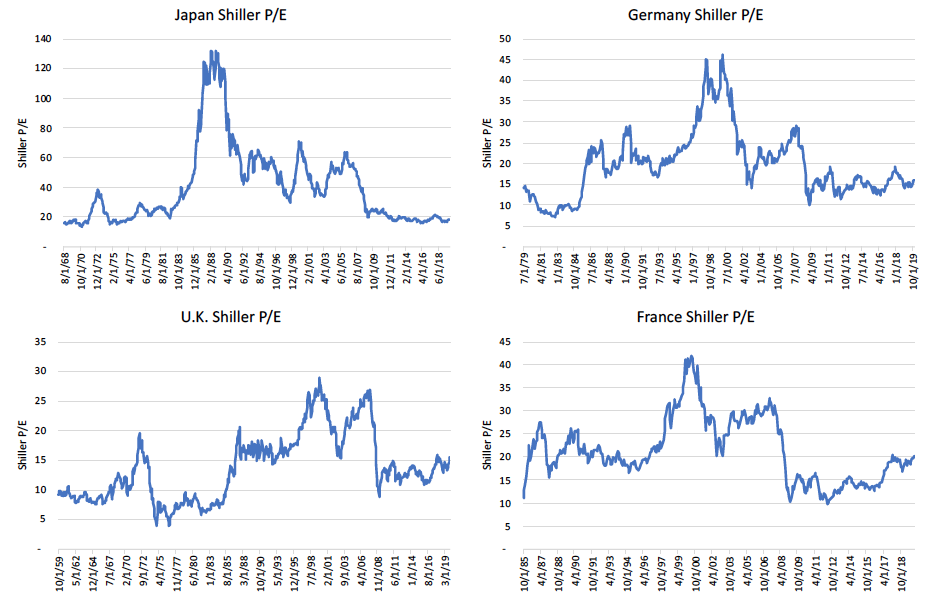
Each of the largest developed international countries have valuations within one standard deviation of their median, implying a normal range of returns going forward. Over the last 50 years, developed international equities have averaged 9.33% annually, and with normal valuations this is our current expectation.
How about emerging markets? Look at valuations for the BRIC countries, the four largest emerging market countries.
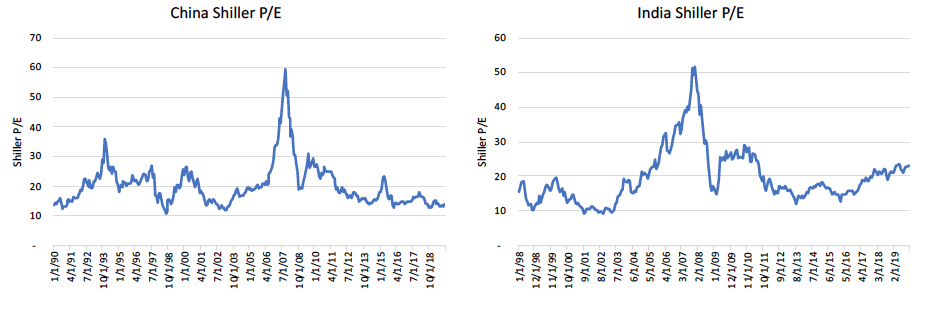
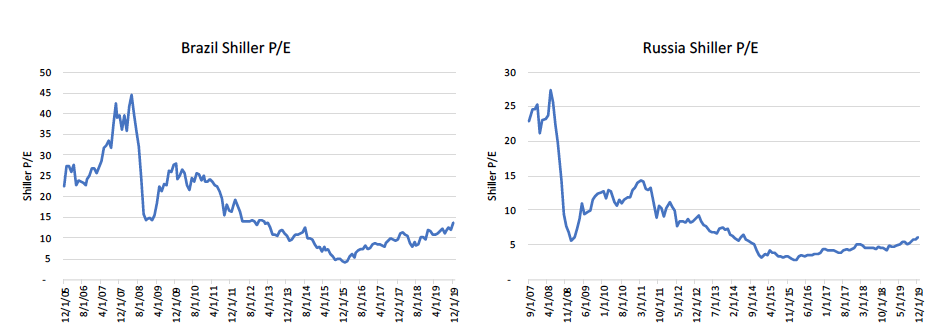
Each of the largest emerging market countries have valuations within one standard deviation of their median, implying a normal range of returns going forward. Over the last 50 years, emerging market equities have averaged 12.02% annually. More conservatively we’ll assume the same 9.33% developed international equities earned to set our expectations.
For international stocks in total, we’ll make a rough assumption of 70% in developed and 30% in emerging markets. We should expect a return of .70%*9.33% + .30*9.33 = 9.33% on our international equities.
Now we get to the difficult stuff: real estate, gold and commodities.
Real estate is a bit troubling. We haven’t found any literature pointing to a framework to determine expected returns here (and if you know of any, please share.) Looking at historical data, REITS have averaged 8.90% over the last fifty years, and 8.18% since 2000. Taking a global approach and employing a reasonable amount of conservatism, let’s assume midway between our expectations for U.S. stocks (3.55%) and international stocks (9.33%). Thus, 6.44% seems like a reasonable expectation from REITS.
Gold and commodities are the most difficult to set expectations around, with no intrinsic value, earnings or dividends. Looking at the historical data, gold has averaged 7.83% over the last fifty years, and 8.64% since 2000. Let’s take the lower of the two and assume 7.83% for gold. Similarly, commodities have averaged 6.73% over the last 50 years, but only -0.33% since 2000. To be conservative, let’s average the two periods and end with 3.20% as our outlook for commodities.
I define the diversified portfolio as equally weighted between each asset class; U.S. stocks, U.S. bonds, international stocks, international bonds, real estate, gold and commodities. This is not how I recommend allocating a portfolio, but it is a reasonable way to discuss the features of diversification in general.
The expectation for a diversified portfolio would be 1/7 of each of the individual pieces, or:
(1/7)*3.55% + (1/7)*1.92% + (1/7)*2.00% + (1/7)*9.33% + (1/7)*6.44% + (1/7)*7.83% + (1/7)*3.20% = 4.90%.
As we did with the 70/30 portfolio, we add in the average diversification return. The median diversification return for a diversified portfolio over 10-year periods is 1.12% annually.
Taken together, our expectations for a diversified portfolio are 6.02%. This is almost double the expectation from a 70/30 portfolio. But don’t take my word for it. Plug in your own assumptions and position sizes.
We’ve never been faced with such low expectations on both U.S. equities and U.S. bonds at the same time. Today’s domestic investing market implies that this is possibly the most important time in history for investors to be eschewing home bias and embracing a multi asset class globally diversified portfolio. Let us be clear: the odds seem heavily stacked in the favor of diversification.
Randy Kurtz, CFP, is chief investment officer of DataDriven Advisor LLC.