


A lot has happened over the past year to change the nature of risk in the stock market. As the threat of Covid-19 wanes, economists are increasingly turning their attention to other threats, including possible inflation and the effect of climate change on the economy, not to mention the emergence of the “meme” stocks that suddenly shoot up in possibly unsustainable value.
But behind these risks lurk more perennial ones: Investors’ holdings are increasingly concentrated, and they have taken on more leverage to purchase securities. When taken together, these two things represent warning signs of market vulnerability, and when they unravel, they can multiply market shocks, since those investors who are too leveraged can be forced to sell during a market downturn. When their holdings are concentrated, that selling focuses on a few markets or sectors.
In the extreme, the result can be a crisis cycle: Forced selling means prices drop further. The feedback continues and worsens as more investors, even those who aren’t as levered up, are pushed into the fray and unload their holdings.
These dynamics accelerate when sudden and extreme market action dries up investors’ liquidity. As more and more people sell, those on the other side of the trade—the liquidity providers—are caught off guard by the sudden drop and move to the sidelines.
If we want to understand the risk, we need to look at the market today, and leverage is at the forefront.
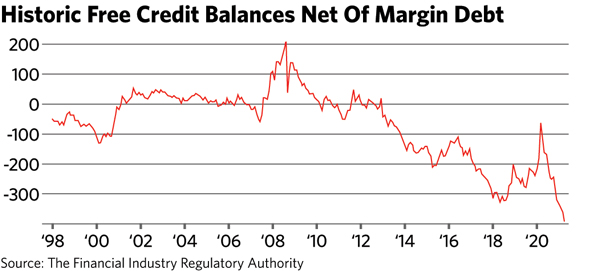
Let’s first consider free credit balances and margin debt—i.e., loans to investors from brokerage firms. The loans are collateralized by securities. If the securities go south, that collateral is sold, adding downward pressure on the market. The free credit balances are investor money that the brokerages are holding—cash swept into brokerage accounts, for example. (These are the “positive” while margin loans are the “negative.”) Take these things together, and you get a holistic measure: The lower the value, the greater the leverage.
As the first chart shows, free credit balances net of margin debt is at the lowest level in two decades.
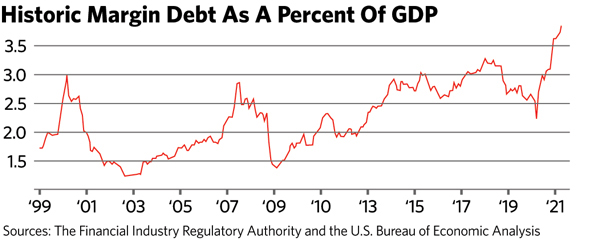
Another common way to look at market leverage is to normalize it by comparing it to either market capitalization or GDP, since rising equity prices will in their own right increase the dollar amount of a given leverage multiple.
The second chart shows margin debt as a percent of GDP. It is at the highest level in the past two decades.
It is natural for margin debt to increase during bull markets, and thus the rising market tends to be “spring-loaded” to accelerate a retreat.
One of the concerns economists should have about high leverage is the amount of “hot money” in the market—money that will be quick to move out if widespread investor sentiment changes. Money from the home market tends to be stable, while investments from foreign sources are not. Put another way, hot money is not going to stay around to provide liquidity when those with leverage are in forced-selling mode.
So to get a broader picture of leverage-related risk, we turn to the liquidity supply side. One way to measure that is inflows from foreigners, shown in the chart below as a one-year moving average. Like the margin measures, growth in new foreign equity purchases is at an extreme, the highest in two decades. Granted, the inflows are accentuated by the higher value of the U.S. equity market, but the level of net inflows is at a record high nonetheless.
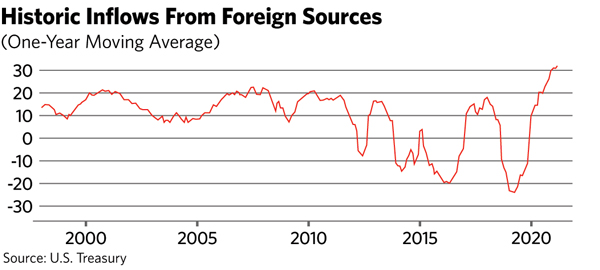
This not only suggests less liquidity supply to meet leverage-based demand, it also suggests that any price effect from leverage will extend beyond the U.S. That is, there is a ready pathway for contagion.
Rick Bookstaber is the founder and head of risk at Fabric RQ. He previously held chief risk officer roles at Morgan Stanley, Salomon Brothers, Bridgewater Associates and the University of California, and he served at the U.S. Treasury in the aftermath of the 2008 crisis. He is the author of The End of Theory (Princeton University, 2017) and A Demon of Our Own Design.