Today’s stock market almost appears to be levitating. From January 1, 2017 to January 12, 2018, the S&P 500 Index surged 27 percent, and the ride was remarkably smooth. To put the recent market calm in some context, we looked back in history.
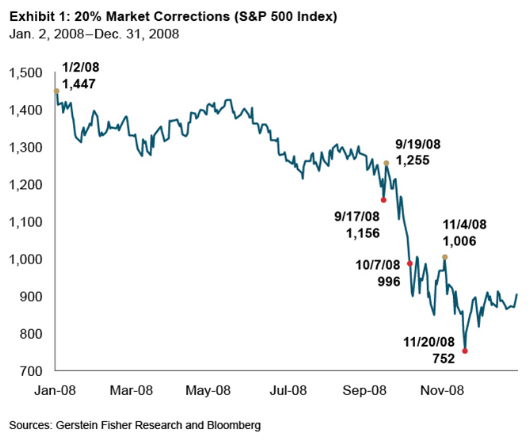
We tallied market corrections of 10 percent, 20 percent and 30 percent by calendar year from 1928 to 2017. We used a “rolling-window” methodology, which works like this: If the market falls 10 percent from its high point during a calendar year, then a 10 percent correction is registered and a new rolling window opens (the first rolling period of each year begins at the start of January). Thus, in a sharply declining market, multiple 10 percent corrections can occur in one calendar year. For example, using this rolling-window method, we counted three 20 percent corrections (Exhibit 1) during calamitous 2008 (recorded on September 17, October 7 and November 20, 2008).
To assess the recently balmy seas, we separated market history into two periods, 1928 to 2009 and 2010 to 2017. During the 82 years from 1928 to 2009, as depicted in Exhibit 2, we counted 155 10 percent corrections, or about two per calendar year; 39 20 percent corrections (roughly one every two years); and 13 30 percent swoons (one per six years).
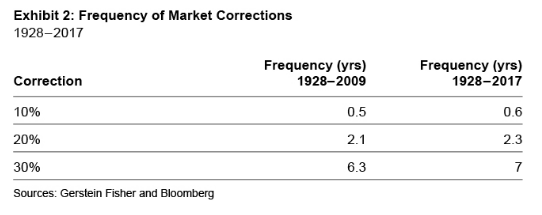
Then something changed during the bull market of 2010 to 2017, perhaps due to the slow but steady nature of the economic recovery since the trauma of the 2008-2009 financial crisis, or stemming from the low-interest rate, monetary-stimulus policies of the Federal Reserve and other key central banks. During this 8-year stretch, only three 10 percent corrections occurred and no 20 percent or 30 percent drops.
Related, we also researched maximum market drawdowns (which was defined to be the maximum loss percent from a peak to a trough) in each calendar year from 1928 to 2017 (Exhibit 3). For example, the maximum drawdown of 2008 was 48 percent when the market dropped from 1447.2 on 1/2/2008 to 752.44 on 11/20/2008. Again, by historical standards, we found that 2009 to 2017 was remarkably peaceful, even when compared to other bull-market environments. From 1928 to 2009, the average maximum drawdown was 17 percent, whereas since 2009 it has been just 10 percent. In fact, calendar 2017, when market volatility went into hibernation, shares a place in the record books, with 1995, as the only year during which the maximum dip (from March 1 to April 13, 2017) was less than 3 percent dip.

How long will these placid seas continue? Just as with today’s richly valued, levitating markets, we make no forecast for when the cycle will turn (for more on the hazards of market timing in high-valuation markets, see “Fear of (Market) Heights.” But we see no reason to believe that volatility in stock markets has been repealed, and are concerned that many investors have been lulled into complacency by the historically smooth ride of recent years. Perhaps the trigger for greater volatility will be rising interest rates, a spike in inflation or a geopolitical event. Or perhaps there won’t even be a proximate cause for a shift in market climate. As the late economist Herbert Stein wittily remarked: “If something cannot go on forever, it will stop.”
Gregg S. Fisher, CFA, is founder, head of quantitative research and portfolio strategist at Gerstein Fisher.