


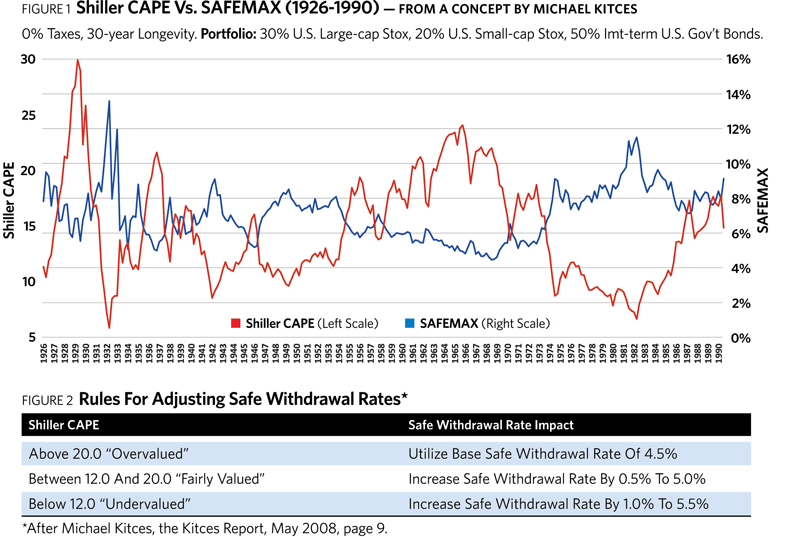
The implications of Michael’s discovery are intriguing. The “4.5% rule” has sometimes been criticized for “leaving too much on the table.” In other words, the retiree was left in many cases with so much wealth at the end of retirement that the withdrawals could clearly have begun at a much higher rate. Figure 1 suggests that the initial withdrawal rate might be tailored to market valuations at the start of retirement. In fact, Michael devised such a schedule, which is presented in Figure 2.
This is a true pioneering effort on Michael’s part, the first attempt to rationalize the use of initial withdrawal rates higher than 4.5%, based on initial market conditions. I was tremendously excited when I first read it. It is a very insightful piece of research.
In this article, I would like to recommend some refinements to his method. I have several reasons for looking beyond his original work.
First, as can be seen in Figure 1, there were many occasions in the past when withdrawal rates higher than even 5.5% could have been successfully employed. In fact, the average SAFEMAX for all retirees for the years 1926 to 1990 was 7.0%—much higher than the “worst case” scenario of 4.5%. It seemed to me, therefore, that it would be useful to have a method that prescribed high withdrawal rates when the right conditions existed.
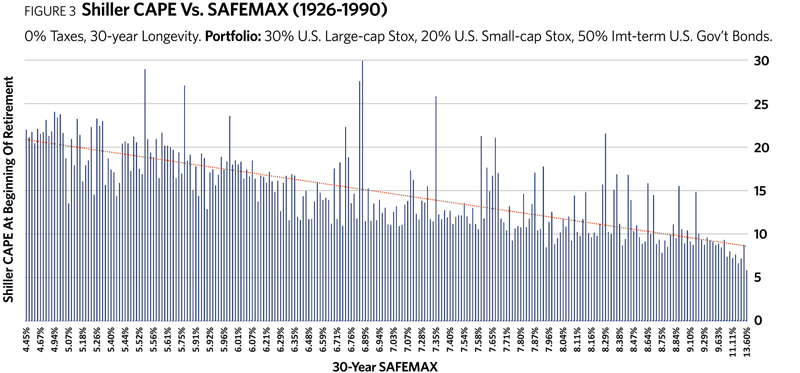
Second, consider Figure 3. This chart contains the same data as in Figure 1, but plots the safe withdrawal rate against the Shiller CAPE ratio directly, without referencing retirement dates. The pattern of the SAFEMAX rising when the Shiller CAPE declines is again plainly evident, but this chart also highlights extreme “outliers.” This suggests that Shiller CAPE alone is not sufficient to predict withdrawal rates.
For instance, there were times when high CAPE values resulted in surprisingly high SAFEMAX values. These can be seen jutting out far above the trend line in Figure 3. We can explain this in part by comparing the CAPE at the end of 30 years with its level at the beginning of retirement. If the ratio is higher at the end of your retirement, then your portfolio growth has enjoyed tailwinds from an increase in valuations, and your SAFEMAX would tend to be higher than if the CAPE ratio had remained the same. The converse is true for the CAPE ratio that declines during your retirement.
Of course, no one can predict what the CAPE ratio will be at the end of somebody’s retirement, so it’s useless for specifying anything else, including SAFEMAX. Also, as stated earlier, CAPE at the beginning of the 30-year time frame can’t by itself be used to specify the safe withdrawal rate to a high degree of accuracy when we consider all the extreme outliers (those that appear in Figure 3). Other factors must be examined. One factor I have discovered to be enormously useful in refining the predictability of SAFEMAX, in conjunction with the initial CAPE ratio, is inflation.
Why is inflation important in this regard? Consider a retirement portfolio as a balloon with two opposing holes. On one side of the balloon, “portfolio returns” in the form of capital gains, dividends and interest are inflating it. On the other side, “periodic withdrawals” are deflating it. The constant pressure between these two forces determines the long-term sustainability of the portfolio.