How do you determine the “safe” portfolio withdrawal rate (what I call “SAFEMAX”) for clients at the beginning of retirement? My research over many years indicates that an initial withdrawal rate of 4.5% sustained all portfolios from 1926 up until now (when we assume that you had a tax-advantaged account, annual CPI adjustments and a minimum of 30 years of portfolio longevity).
But that is based on a “worst case” scenario—for the individual who retired on October 1, 1968, and suffered through years of poor stock market returns and high inflation. Retirees facing more favorable market circumstances, on the other hand, have been able to successfully withdraw up to 13% of their portfolios. So how do we determine a safe withdrawal rate that fits a particular environment—one hopefully significantly higher than 4.5%?
To begin our quest, I am privileged to present an updated version of what I consider to be the single most important chart ever devised pertaining to “sustainable withdrawals” (Figure 1). It was created by Michael Kitces, the renowned financial advisor, and it first appeared in his publication “The Kitces Report” in May 2008. This chart plots the Shiller CAPE (the cyclically adjusted price-earnings ratio for the S&P 500) against the “safe” historical maximum withdrawal rate for the first day of every quarter, from 1926 through 1990, which adds up to 260 scenarios.
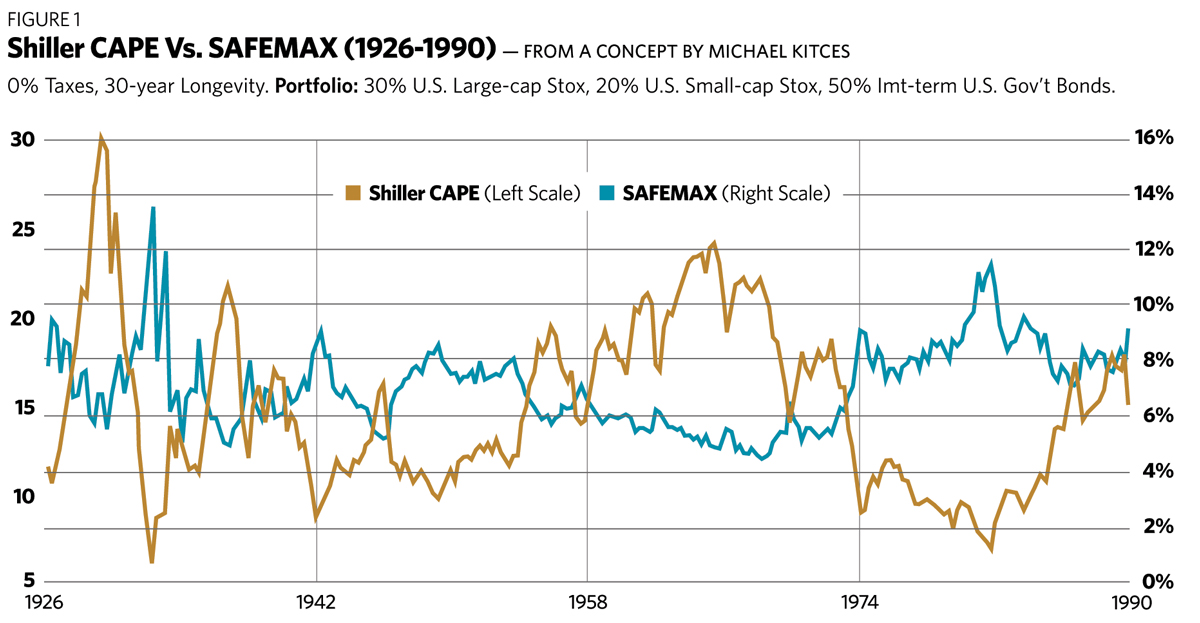
First, a few definitions (they may be superfluous, but let’s be certain we are on the same page). The “Shiller CAPE” was devised by Professor Robert Shiller of Yale University. This metric represents a P/E for all the companies in the S&P 500, based on their current stock prices and the previous 10 years of inflation-adjusted earnings. It seeks to “smooth out” short-term fluctuations in earnings and come up with a P/E representative of the true earning power of the companies involved.
“SAFEMAX” is a term I devised in my own research. It represents the highest first-year withdrawal rate (the dollar withdrawal divided by initial portfolio value) that historically sustained a retiree’s portfolio for a given period of time—in this case, 30 years—when the portfolio was tax-advantaged. The rebalancing is annual, and the target portfolio consists of 30% U.S. large-cap stocks, 20% U.S. small-cap stocks and 50% intermediate-term U.S. government bonds.
I have updated Michael’s chart to incorporate recent data. Note that in my analysis I used retirement dates on the first day of each quarter, while Michael’s original chart used annual retirement dates. As a result, my chart has many more data points, and shows more of the “fine structure” of the relationship between CAPE and SAFEMAX. Because 30 years of data is required, the most recent retirement portfolio begins January 1, 1990 (and ends December 31, 2019).
Examining the chart, one is immediately struck by the countervailing behavior of the two data series. High initial withdrawal rates are consistently associated with “cheap” stock markets, and low initial withdrawal rates are associated with “expensive” stock markets. The correlation between the two data series is negative 0.75, which is quite strong. Obviously, it paid to retire when stocks were cheap!
The implications of Michael’s discovery are intriguing. The “4.5% rule” has sometimes been criticized for “leaving too much on the table.” In other words, the retiree was left in many cases with so much wealth at the end of retirement that the withdrawals could clearly have begun at a much higher rate. Figure 1 suggests that the initial withdrawal rate might be tailored to market valuations at the start of retirement. In fact, Michael devised such a schedule, which is presented in Figure 2.

This is a true pioneering effort on Michael’s part, the first attempt to rationalize the use of initial withdrawal rates higher than 4.5%, based on initial market conditions. I was tremendously excited when I first read it. It is a very insightful piece of research.
In this article, I would like to recommend some refinements to his method. I have several reasons for looking beyond his original work.
First, as can be seen in Figure 1, there were many occasions in the past when withdrawal rates higher than even 5.5% could have been successfully employed. In fact, the average SAFEMAX for all retirees for the years 1926 to 1990 was 7.0%—much higher than the “worst case” scenario of 4.5%. It seemed to me, therefore, that it would be useful to have a method that prescribed high withdrawal rates when the right conditions existed.
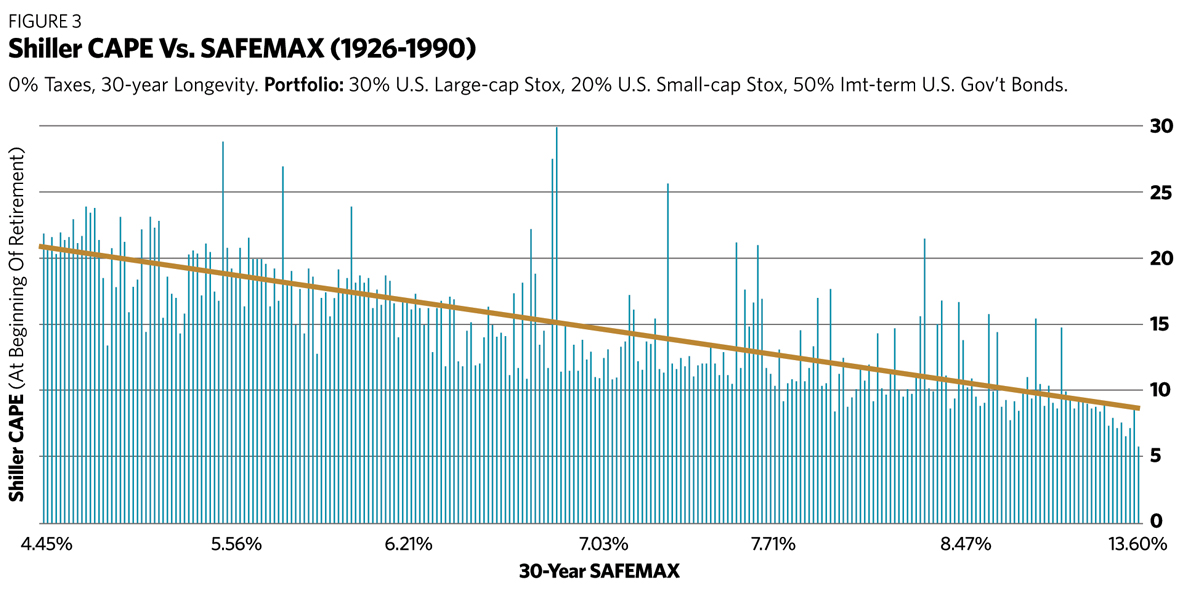
Second, consider Figure 3. This chart contains the same data as in Figure 1, but plots the safe withdrawal rate against the Shiller CAPE ratio directly, without referencing retirement dates. The pattern of the SAFEMAX rising when the Shiller CAPE declines is again plainly evident, but this chart also highlights extreme “outliers.” This suggests that Shiller CAPE alone is not sufficient to predict withdrawal rates.
For instance, there were times when high CAPE values resulted in surprisingly high SAFEMAX values. These can be seen jutting out far above the trend line in Figure 3. We can explain this in part by comparing the CAPE at the end of 30 years with its level at the beginning of retirement. If the ratio is higher at the end of your retirement, then your portfolio growth has enjoyed tailwinds from an increase in valuations, and your SAFEMAX would tend to be higher than if the CAPE ratio had remained the same. The converse is true for the CAPE ratio that declines during your retirement.
Of course, no one can predict what the CAPE ratio will be at the end of somebody’s retirement, so it’s useless for specifying anything else, including SAFEMAX. Also, as stated earlier, CAPE at the beginning of the 30-year time frame can’t by itself be used to specify the safe withdrawal rate to a high degree of accuracy when we consider all the extreme outliers (those that appear in Figure 3). Other factors must be examined. One factor I have discovered to be enormously useful in refining the predictability of SAFEMAX, in conjunction with the initial CAPE ratio, is inflation.
Why is inflation important in this regard? Consider a retirement portfolio as a balloon with two opposing holes. On one side of the balloon, “portfolio returns” in the form of capital gains, dividends and interest are inflating it. On the other side, “periodic withdrawals” are deflating it. The constant pressure between these two forces determines the long-term sustainability of the portfolio.
Inflation directly affects the periodic withdrawals, as it is assumed that dollar withdrawals are increased annually by CPI. If inflation is high, it results in rapidly increasing withdrawals. These increases are, in effect, “locked in” for the life of the portfolio, since prolonged periods of significant deflation, which would be required to offset them, have been rare.
Thus, inflation is very important to a portfolio’s sustainability. Consider Figure 4, which lists critical data for five past retirees.
Each of these five retirees began retirement when the Shiller CAPE ratio was about the same. But they experienced widely different safe withdrawal rates. This difference is not explained by the PE ratio at the end of 30 years. In fact, for several dates in Figure 4, a higher ending CAPE ratio resulted in a lower safe withdrawal rate than for other dates. This defies expectations, but the inflation trend hints at a reliable cause-and-effect relationship. As inflation (defined as the trailing 12-month Consumer Price Index at retirement) increases from top to bottom, SAFEMAX correspondingly declines.
 I can’t emphasize enough the importance of inflation to a portfolio’s sustainability. The time line of inflation that a retiree experiences when they stop working is as important to their portfolio’s endurance as the sequence of investment returns, which has received much greater attention. This truth has been masked by a history of generally low inflation in the United States over the last 100 years (leaving out the 1970s and the period from 1948 to 1952).
In Figures 5 through 10, I present my scheme for selecting the maximum safe withdrawal rate. It requires knowledge of the beginning CAPE and the CPI for the 12 months before a person’s retirement date, two figures that are usually readily available. First, you should identify the chart showing the prevailing inflation regime, which is determined by the 12-month trailing CPI (if you have strong feelings that the inflation regime will change in the near future, you can choose another chart). Then you can locate the current Shiller CAPE ratio in the left column of the chart, and then the corresponding historical SAFEMAX in the right column. Voilà!
I developed the SAFEMAX values by sorting the entire database using inflation regimes, then by sub-sorting using the beginning CAPE ratio within each regime. I ignored data for which the 30-year price-earnings ratios were 30% more or less than the long-term average of 17.05; in other words, I anticipated approximate reversion to the mean of the Shiller CAPE. I felt that much larger deviations created unrealistically high or low safe withdrawal values. Even so, my permissible 30-year CAPE ratio has a wide range, from approximately 12 to 22.
The choices for SAFEMAX were not always clear-cut, and there is quite a bit of subjectivity in my selections. In many cases, there were just a small number of applicable retirement scenarios. When in doubt, I chose the more conservative value of SAFEMAX. Overall, I was struck by the high degree of consistency by which the safe withdrawal rate responded to a combination of the beginning CAPE ratio and inflation.

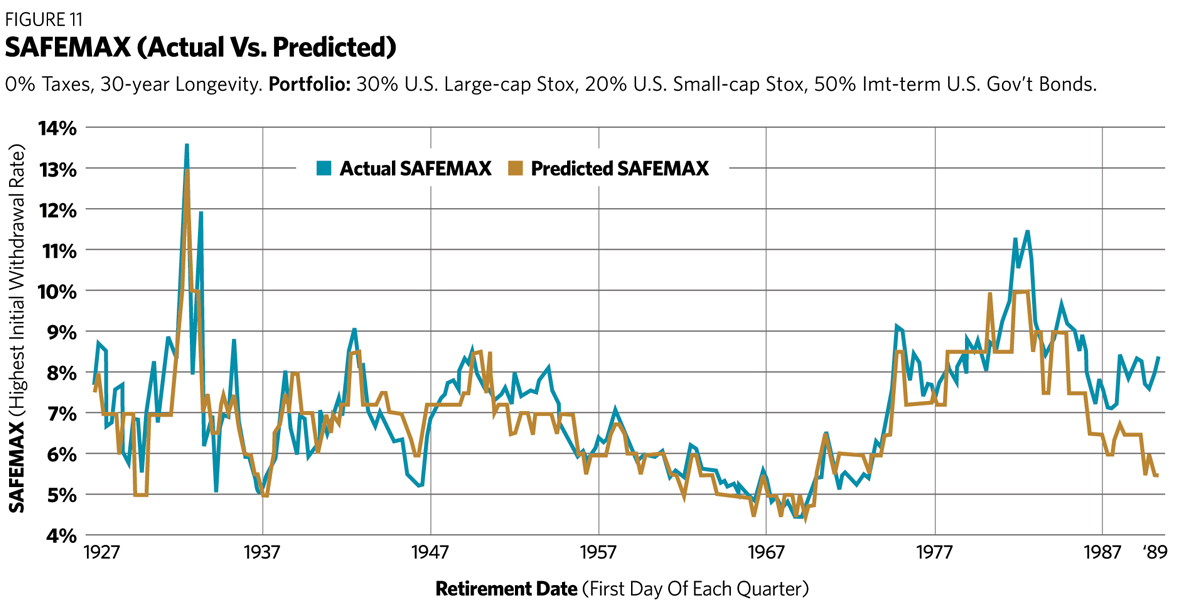
Figure 11 compares the historically computed safe withdrawal rate with the SAFEMAX predicted by my tabular method. It’s not a perfect fit (the correlation is 86%), but that’s hardly to be expected. My method depends on two initial conditions, the CAPE ratio and inflation. If either one of these changes significantly during the life of the portfolio, the withdrawal rate could be affected. An example of this occurs at the right end of the chart, where SAFEMAX values in the late 1980s were inflated by unusually high stock market valuations 30 years later, something my approach could not anticipate. Overall, my method accomplishes its objective of specifying withdrawal rates that are in reasonable agreement with those actually achieved in the past.
I apologize for the complexity of my six-table scheme, given the elegant simplicity of Michael’s one-table version. However, I believe that the added complexity is justified by the much wider range of SAFEMAX choices offered. If the right circumstances present themselves, perhaps you can make some future client happy by recommending a 10% withdrawal rate!
Unfortunately, as Michael observed in his 2008 article, the “CAPE needle” has been jammed against the upper valuation stops for almost all of the last 25 years. As a result, almost the only choice for safe withdrawal rates has been the highest CAPE value in each table.
The sole exception to this dilemma occurred in the 12 months following the market bottom in March 2009, when the Shiller CAPE ratio temporarily fell below its long-term average. For example, the April 1, 2009, retiree had a 14.98 CAPE in a low-inflation environment, which according to Figure 8 corresponds to a 6.5% safe withdrawal rate.
Those retirees withdrawing at that rate since that day would have seen their portfolio gain 51% in nominal value, making it highly likely it will sustain them for the full 30 years. This provides some modest verification for the method I have expounded above.
In summary, this article has presented a tabular method to select an initial withdrawal rate for retirement portfolios, based on both recent inflation and stock market valuations. It exhibits a wide range of choices, between the “worst case” of 4.5% and a high of 13%, representing the full range of historically successful withdrawal rates. It is simple to use, though right now it applies only to tax-advantaged portfolios with a desired longevity of 30 years.
I should also issue the usual cheerful disclaimer that this research is based on the analysis of historical data, and its application to future situations involves risk, as the future may differ significantly from the past. The term “safe” is meaningful only in its historical context, and does not imply a guarantee of future applicability.
William P. Bengen is a retired financial advisor who first conceived the 4.5% SAFEMAX withdrawal rate. He lives in La Quinta, Calif.