


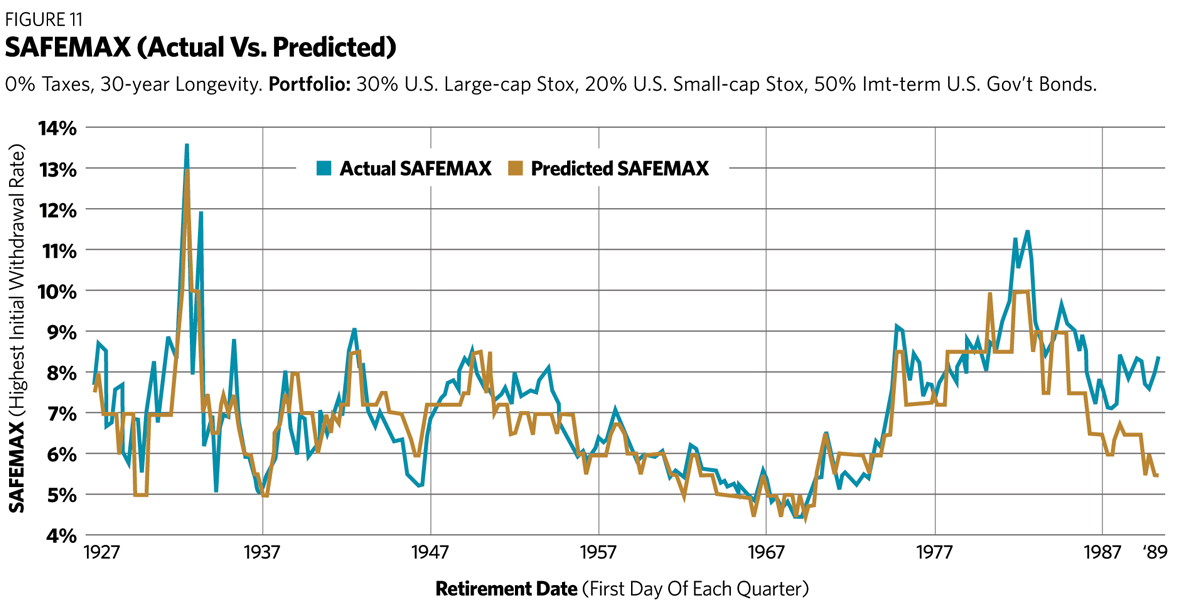
Figure 11 compares the historically computed safe withdrawal rate with the SAFEMAX predicted by my tabular method. It’s not a perfect fit (the correlation is 86%), but that’s hardly to be expected. My method depends on two initial conditions, the CAPE ratio and inflation. If either one of these changes significantly during the life of the portfolio, the withdrawal rate could be affected. An example of this occurs at the right end of the chart, where SAFEMAX values in the late 1980s were inflated by unusually high stock market valuations 30 years later, something my approach could not anticipate. Overall, my method accomplishes its objective of specifying withdrawal rates that are in reasonable agreement with those actually achieved in the past.
I apologize for the complexity of my six-table scheme, given the elegant simplicity of Michael’s one-table version. However, I believe that the added complexity is justified by the much wider range of SAFEMAX choices offered. If the right circumstances present themselves, perhaps you can make some future client happy by recommending a 10% withdrawal rate!
Unfortunately, as Michael observed in his 2008 article, the “CAPE needle” has been jammed against the upper valuation stops for almost all of the last 25 years. As a result, almost the only choice for safe withdrawal rates has been the highest CAPE value in each table.
The sole exception to this dilemma occurred in the 12 months following the market bottom in March 2009, when the Shiller CAPE ratio temporarily fell below its long-term average. For example, the April 1, 2009, retiree had a 14.98 CAPE in a low-inflation environment, which according to Figure 8 corresponds to a 6.5% safe withdrawal rate.
Those retirees withdrawing at that rate since that day would have seen their portfolio gain 51% in nominal value, making it highly likely it will sustain them for the full 30 years. This provides some modest verification for the method I have expounded above.
In summary, this article has presented a tabular method to select an initial withdrawal rate for retirement portfolios, based on both recent inflation and stock market valuations. It exhibits a wide range of choices, between the “worst case” of 4.5% and a high of 13%, representing the full range of historically successful withdrawal rates. It is simple to use, though right now it applies only to tax-advantaged portfolios with a desired longevity of 30 years.
I should also issue the usual cheerful disclaimer that this research is based on the analysis of historical data, and its application to future situations involves risk, as the future may differ significantly from the past. The term “safe” is meaningful only in its historical context, and does not imply a guarantee of future applicability.
William P. Bengen is a retired financial advisor who first conceived the 4.5% SAFEMAX withdrawal rate. He lives in La Quinta, Calif.