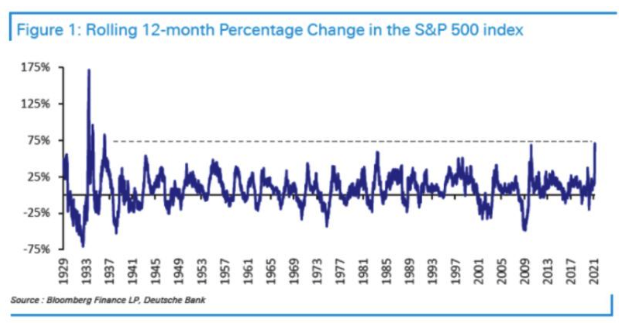
Congratulations: We have just finished the best 12 months in the history of the S&P 500. It was exactly a year ago that the world’s most followed index hit bottom after the onset of the Covid-19 pandemic, and it has since gained more than 70%. Jim Reid, of Deutsche Bank AG, puts the return in perspective, back-calculating the index — which was launched in 1957 — to 1929, the year of the Great Crash:
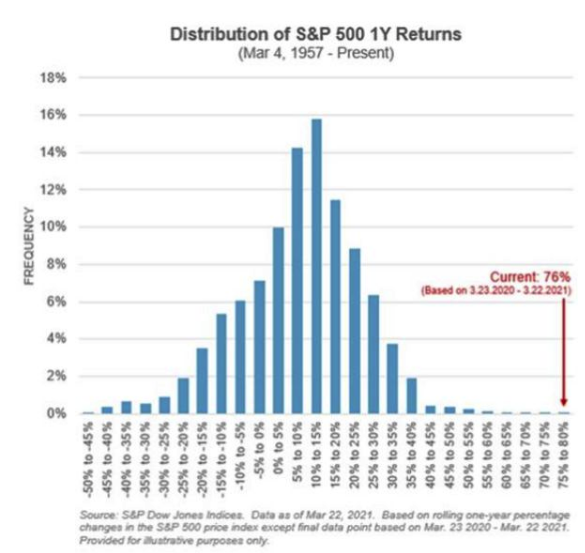
Other than the rebound following the greatest of crashes, there have never been 12 months like this. And to see how much of an outlier the last year has been, look at one-year returns since 1957, as produced by S&P Global. Overall, the pattern is as might be expected. Stock markets tend to go up steadily most of the time, punctuated by occasional sharp falls. It’s no surprise to see that the distribution is skewed to the right, meaning that in most yearlong periods the index goes up; or that it has “fat tails” on the left side, meaning that there are more really bad years than you might expect. What just happened is an extreme positive outlier. There was no historical reason for anyone to suspect that the last 12 months would be this good:
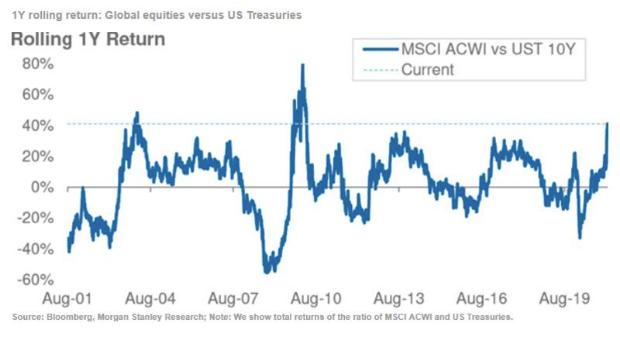
The U.S. stock market doesn’t exist in a vacuum. If we look at equities in comparison with other assets, we find that global stocks have had two better years relative to bonds in this century so far — the rebounds following the invasion of Iraq in early 2003, and the final pit of the global financial crisis in 2009. This one is very close to those, as shown by the following chart from Morgan Stanley:
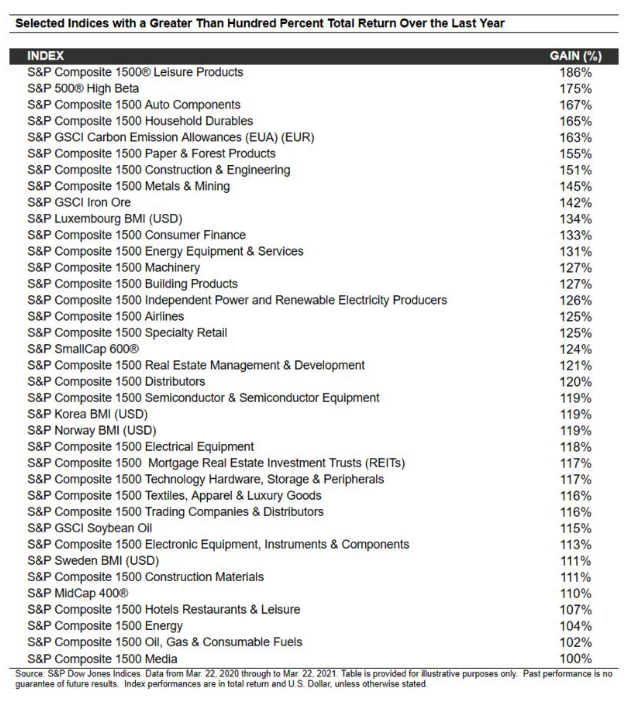
There are also plenty of assets that have done far better even than the S&P 500. Tim Edwards of S&P provided the following list, which was good up to Monday’s close of play, and so missed a poor day for the U.S. stock market on Tuesday. It’s eclectic, to say the least:
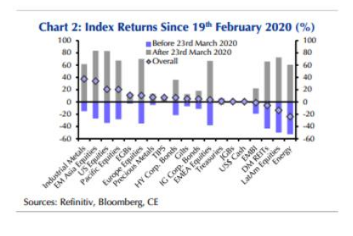
Many assets only did so well because they had sold off so drastically ahead of March 23 last year. The following chart from Capital Economics of London ranks assets by returns (shown by diamonds in the chart) since Feb. 19 last year, when the S&P peaked. Over that extended period, it has paid to invest in China, with industrial metals and emerging Asian stocks the winners. Energy, real estate and emerging markets further from China’s orbit are still below their levels of last February: