Riding For A Fall?
Let’s look to the short term. Not for the first time, a new decade has started with stock markets roaring ahead, and tech in the lead, while optimism abounds. This famously happened in 2000.
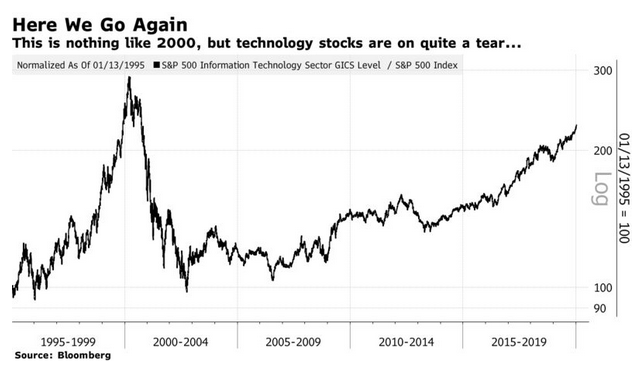
As the following chart shows, the enthusiasm for all things tech is nothing like as overheated as it was 2000. But tech stocks have indeed enjoyed their longest run of outperformance in many years. That run only got going seriously in 2016. At this point, tech has made up all the ground it has lost to the market as a whole since October 2000:
Does this mean that markets have been fooled again? No, but it is hard to ignore the evidence that positioning is beginning to look excessive. For the time being, we will leave out valuations, which have suggested for some years that the U.S. stock market is overpriced. This hasn’t stopped them from growing more stretched and making money for those who held stocks in the process.
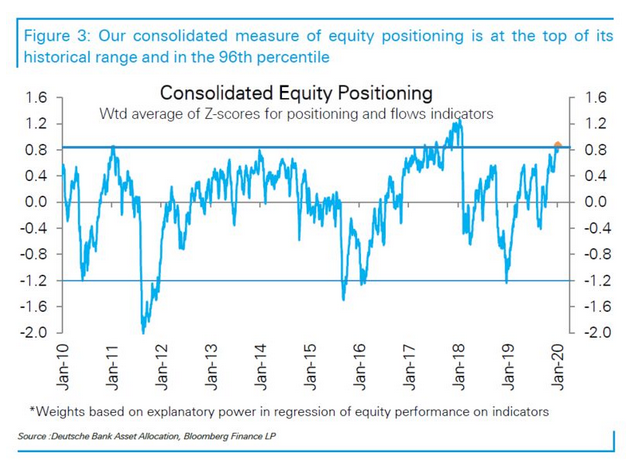
If valuation doesn’t help with timing, however, a look at how investors are positioned in equities compared to other asset classes might give more direct evidence. And according to Deutsche Bank AG’s preferred measure, positioning toward equities has been more extreme only 4% of the time in the last decade. The only time investors were this heavily invested in equities came two years ago, in the run-up to the violent sell-off of February 2018:
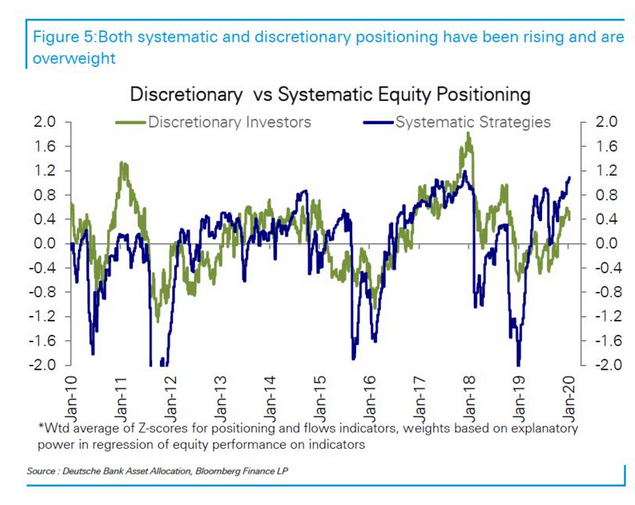
How much do quants and passive strategies have to do with this? Again according to Deutsche Bank, using data compiled by Bloomberg, it appears that systematic strategies are now even more overweight in equities than discretionary investors are. Indeed, the enthusiasm of the systematic strategies exceeds that of the humans to a greater extent than at any point in the last decade. As the importance of systematic investing has only risen throughout this period, that suggests that we should take the current overweighting seriously. The quants got out of equities in a very big (and with hindsight mistaken) way during the big sell-off at the end of 2018, so there is every reason to believe that they could do the same again.
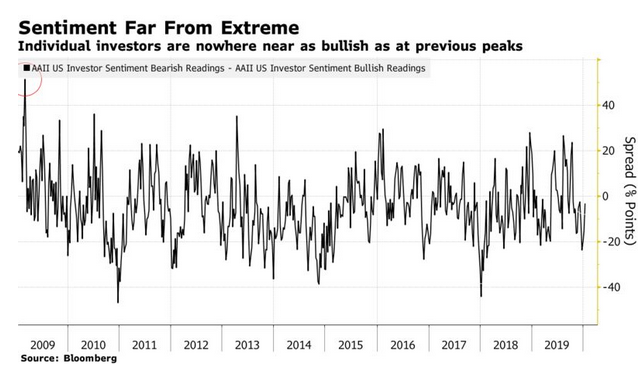
This is a shame because individual investors, a far less influential group than they used to be, are far more balanced in their approach to the current market. The regular survey of the American Association of Individual Investors asking if members are feeling bullish or bearish has been an excellent contrarian indicator over the years. The historic extreme of bearishness over bullishness came in the very week that the stock market hit bottom and started to rally in March 2009. The greatest excess of bullishness over bearishness came just ahead of the sell-off in early 2018. At present, the sentiment of individual investors appears unremarkable, with bulls only just outnumbering bears. This is evidence that sentiment isn’t overblown, but this evidence may not be as valuable as it once was, given the advance of the machines.
What could cause a problem? Two years ago, a sudden and impressive rise in bond yields from low levels was widely seen as the culprit. A sudden change in the cost of long-term money can mess up stock markets. The following chart, from David Kostin, chief U.S. equity strategist at Goldman Sachs Group Inc., shows that any rise beyond two standard deviations in a month (which would now require a rise of 34 basis points, or to about 2.2% in short order) tends to cause problems for stocks. The speed of the move in yields, rather than their level, has the greatest impact:

How likely is an increase on that scale? The determined easing policies of central banks make it look far less likely than it was two years ago. Against that, there is heavy bond issuance to fund the growing U.S. deficit, much of which is being swallowed by the Federal Reserve. And as was the case two years ago, the reasons for optimism about stocks also tend to be reasons for higher bond yields. If the global economy is really doing so well, shouldn’t yields be a bit higher?
It is always dangerous to bet on a stock market slide when central banks are helping as keenly as they are at present. But the stock market does indeed look over-extended. The risk of an event to parallel February 2018, if not the epic excitement of March 2000, is real. Whether this comes to pass depends primarily on bond yields.
A World Of Debt
The Institute of International Finance’s latest debt statistics show that the global debt-to-GDP ratio has now topped 322%. That is the highest on record. For China, this figure is 310%, also a record.
While the increase is broad-based and global, the IIF’s sectoral breakdown shows that the big buildup is in exactly the areas that were not so much of a problem during the global financial crisis. Financial sector debt is now lower as a proportion of GDP than it was at the end of 2007, on the eve of the critical phase of the crisis, while households are barely any more leveraged than they were then. These sectors were of course at the center of the problems.

Unfortunately, non-financial firms have piled up leverage since then, while government debt is a much greater share of GDP. The tactic then was to get through the crisis by putting the government’s credit rating behind stricken banks, and to substitute government for financial debt. Financial repression, effectively forcing investors to buy government debt, has enabled that policy to work until now. Can it continue?
This article was provided by Bloomberg News.