“If Santa should fail to call, bears may come to Broad and Wall.” —Yale Hirsh
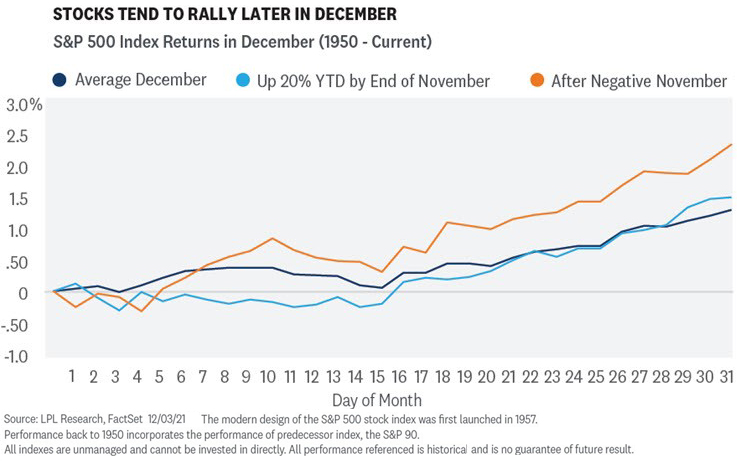
December is widely known as one of the best months of the year for stocks, but most don’t realize that the majority of the gains happen in the second half of the month.
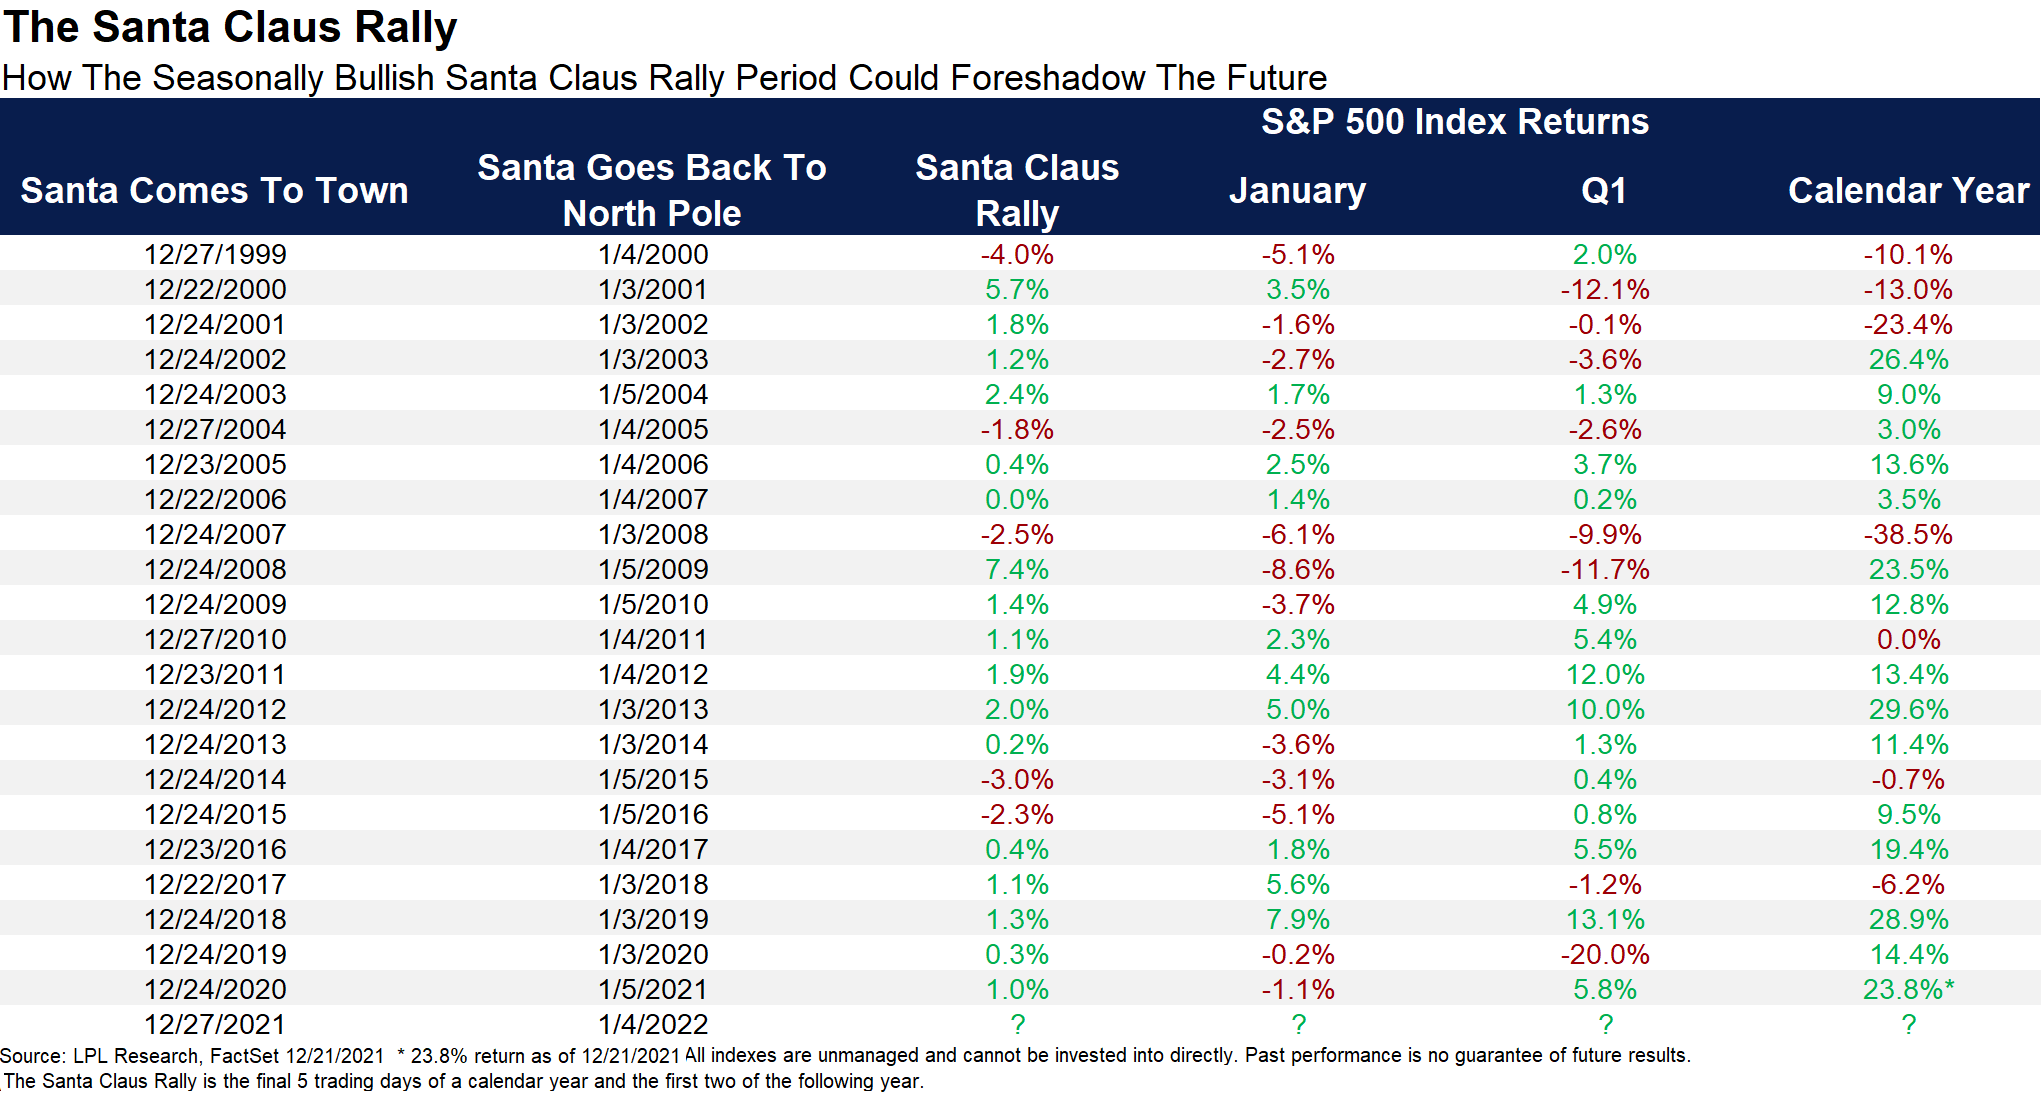
Equity strength at this time of the year is widely known as the Santa Claus Rally, but the term is somewhat misunderstood. Discovered in 1972 by Yale Hirsch, creator of the Stock Trader’s Almanac (carried on now by his son Jeff Hirsch), the real Santa Claus Rally is the final five trading days of the year and first two trading days of the following year, not just December. In other words, the official Santa Claus Rally is set to begin Monday, December 27. Fun trivia this is the latest any Santa Claus Rally can start and latest it has started in 11 years.
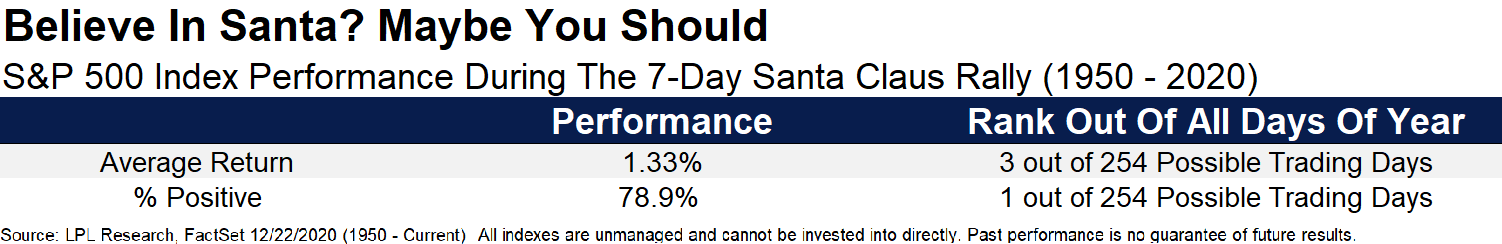
So how likely are these seven trading days to be higher? Well, there isn’t a single seven-day combo out of the full year that is more likely to be higher than the 78.9% of the time higher we’ve seen previously during the Santa Claus Rally. Additionally, these seven days are up an average of 1.33%, which is the third-best seven-day combo of the year. Do you believe yet?
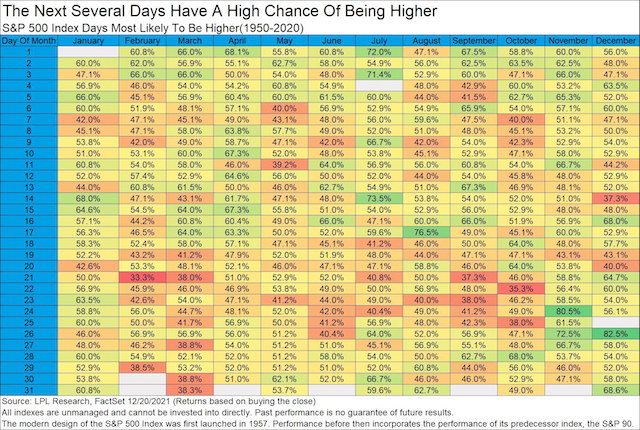
Taking a bigger picture view, here is the win rate of any single day. We are in the middle of an incredible 11-day streak with each day having a greater than 50% chance of being higher.
“Why are these seven days so strong?” asked LPL Financial Chief Market Strategist Ryan Detrick. “Whether optimism over a coming new year, holiday spending, traders on vacation, institutions squaring up their books—or the holiday spirit—the bottom line is that bulls tend to believe in Santa.”
The LPL Chart of the Day illustrates how the Santa Claus Rally has performed since 2000. Usually these seven days are higher, which leads to strength in January and beyond. But what stands out to us is that the times Santa didn’t come, January was lower each time. Now do you believe?