


A lot of comparisons have been made in recent months between the start of the Roaring 1920s and the new decade underway. The similarities are indeed striking. Then, as now, the U.S. was digging out from the public health and economic fallout of a global pandemic even as a wave of new technology was set to transform the country’s political, social and economic landscape.
Those similarities — the Spanish Flu that began in 1918 and the Covid-19 pandemic last year, and mass adoption of electrification and the combustion engine a century ago and the flood of new technology reordering life today — have ignited speculation that another Roaring ’20s is underway. That may be true when it comes to technology or the economy. But the Roaring ’20s also featured a booming stock market, and whatever else may be in store this decade, it’s not likely to include a replay of the raging 1920s bull market.
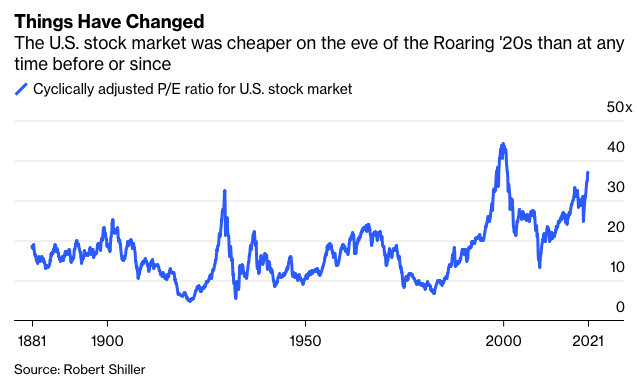
That’s because there is one critical difference between the start of the 1920s and today: As 1920 came to a close, the U.S. stock market was the cheapest on record — before or since — going back at least 140 years, according to a widely followed valuation measure compiled by Yale professor Robert Shiller. Today’s market, by contrast, has been more expensive only once before.
The measure I’m referring to is the cyclically adjusted price-to-earnings, or CAPE, ratio. It compares the price of the S&P 500 Index (and its precursor before 1926) with average inflation-adjusted earnings over the previous 10 years to smooth out the ups and downs of the business cycle. Since 1881, the CAPE has swung between a low of 4.8 and a high of 44.2. The low was recorded in December 1920, just as the Roaring ’20s were set to begin, and the high near the peak of the dot-com bubble in December 1999. The current CAPE ratio of 37 is the second highest behind the infamous dot-com peak.
Importantly, the CAPE ratio signals nothing about what will happen to stock prices in the near term or what path they will take in the years ahead. So a high CAPE doesn’t indicate or even imply that a correction is coming, and inversely, a low CAPE doesn’t mean stocks are poised to take off. But the CAPE has been a good barometer of the return investors can expect from the stock market over the medium term.
That’s probably not a coincidence. To see why, it’s useful to deconstruct the stock market’s total return into its three components: dividend yield, earnings growth and change in valuation. A lower CAPE ratio usually means stock prices have declined and therefore dividend yields have risen (yields and prices move in opposite directions). Also, the lower the CAPE, the more room valuations have to expand, thereby boosting the return from stocks. Provided that earnings grow at least in line with their long-term average, the lift from higher dividend yields or expanding valuations, or both, is likely to produce an above-average return.
That’s exactly what happened during the Roaring ’20s. With a rock-bottom CAPE ratio when the 1920s began, dividends contributed 6.3% a year during the decade and expanding valuations kicked in an additional 3.3%. Earnings growth added 5.6%, which is roughly in line with their historical average, for a grand total of 15.2% a year. Roaring indeed.
The opposite is also true, though. A high CAPE ratio depresses dividend yields and leaves valuations with more room to contract than expand. That puts the burden on earnings growth, and if earnings stumble, the results are likely to be disappointing. That’s what happened during the 2000s. With a sky-high CAPE as the decade began, dividend yields contributed just 1.7% a year during the decade, while contracting valuations cost investors 3% a year. Unfortunately, earnings disappointed, too, growing by just 0.6% a year. The net result was a loss of 0.7% a year for the S&P 500.
The math isn’t much better today. The dividend yield stands at around 1.4%, and valuations are stretched. That means earnings will have to carry the load, as I wrote recently, if investors want stocks to pay this decade. The best investors can reasonably hope is that valuations remain elevated and that earnings continue to grow in the high single digits, in which case the S&P 500 could conceivably generate a return that resembles its long-term average of about 10% a year.
But it’s a big ask. Earnings have never sustained that pace of growth for two decades, nor have valuations hung around such lofty levels for long. Assuming earnings grow in line with their long-term average of roughly 5% a year and valuations contract modestly, investors can expect a return closer to 4% to 6% a year from the S&P 500 this decade. That’s not bad, particularly when bonds offer a lot less, but it’s a far cry from the Roaring ’20s.
It’s not entirely surprising that in the era of meme stocks, cryptocurrencies and SPACs, investors are unburdened by history and data in anticipation of another Roaring ’20s. Yes, there are plenty of reasons to be optimistic about the decade ahead, but it’s unlikely to be a memorable one for the U.S. stock market.
Nir Kaissar is a Bloomberg Opinion columnist covering the markets. He is the founder of Unison Advisors, an asset management firm. He has worked as a lawyer at Sullivan & Cromwell and a consultant at Ernst & Young.