The outperformance of emerging market (EM) stocks in 2017 has investors asking: Is this a game of catch-up or the start of a multi-year winning streak? Some of this year’s performance can be explained by investor efforts to close long-underweight positions. Some can be attributed to improving global growth. We believe there is more to the story, that it goes well beyond China and that EMs have room to run.
Highlights
• The underlying fundamentals for EM equities are improving after five years of declining profitability and weak earnings growth. We believe the recent outperformance is the start of a longer trend and assign the asset class an overweight position.
• Reform progress is central to EM economies and markets reaching their full potential. EM reform is not new, but we are encouraged by a few countries making big headway—with positive implications for equity markets and future earnings.
• The spotlight has focused on EM Asia, led by powerhouse China. But all three major EM regions are contributing to robust earnings growth for the asset class. Our favored markets include India, Indonesia, Brazil and Argentina.
Game On
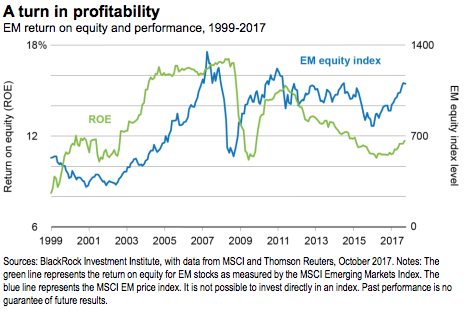
EM earnings and profitability have come a long way. But they’re not done yet, we believe. The past 18 months have brought a broad-based recovery, after earnings of MSCI EM Index companies had slid 7 percent a year since 2011. Both new and old economy sectors (tech, industrials, energy) have contributed. Performance has largely followed. MSCI EM valuations are at their highest since 2010, but 24 percent below developed markets (DMs)—not expensive, on a relative basis. Over-investment (mostly in the resource sectors) and capacity expansion weighed on profitability from 2011-2015. Companies have since slowed investment, which has increased return on equity, as shown below.
From Pain To Gains
A trio of forces offers support for EM equities today: structural reforms that are leading to higher profitability, synchronized global growth fueling improved demand, and stimulative fiscal and monetary policies.
Structural reforms in labor and banking can cause pain in the near-term, braking growth. But in the long-term, welltargeted reforms bring gains, we believe. Why? True structural reform improves the ease of doing business (reducing friction and transaction costs), provides greater flexibility for companies (particularly on hiring and firing), and supports aggregate demand. This feeds into domestically driven earnings growth. The stories go well beyond China.
In Brazil, labor reform passed earlier this year gives companies more flexibility in managing their workforce, potentially leading to lower labor expenses. India has seen some of the most substantial reform progress among EMs, kicked off by Prime Minister Narendra Modi’s election in 2014. Demonetization last November removed a big chunk of cash from circulation in an effort to crack down on tax evasion and corruption.
Another area of focus for the Indian government: digitization of the financial system. Initiatives have included opening roughly 300 million bank accounts for unserved populations over the past three years, and setting up electronic transfers of subsidies and government payments in an effort to support consumption and reduce wasteful spending. Landmark tax reform introduced in July to improve receipts and reduce tax evasion has brought an influx of new registrations to the tax system. Our calculations suggest the country could see a $50 billion boost in receipts annually, raising its low tax-top ratio about two percentage points by 2020.
Company margins have been challenged as the government has undertaken these reforms, but are slowly showing signs of improvement amid lower expenses and inflation. Earnings growth has picked up to more than 10 percent for 2017, according to Thomson Reuters data, and consensus estimates call for 21 percent in 2018, the highest of any major market. Equity markets in India have seen record inflows from domestic investors, at nearly $23 billion through September of this year, according to the Association for Mutual Funds in India.
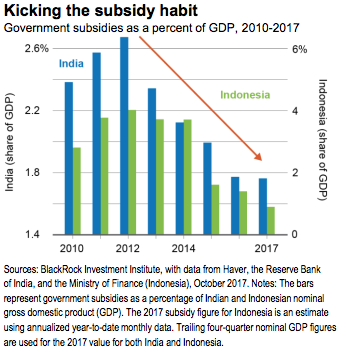
Reform progress is supporting Indonesia’s equity market as well. Government subsidies, mostly on fossil fuels, have fallen two-thirds from a 2012 peak of over 5 percent of GDP. See the Kicking the subsidy habit chart. This frees up funds for spending on infrastructure and lays the groundwork for higher domestic investment.
Indonesia’s currency has weakened over the past five years, but the export benefits have yet to be fully realized. The ease of doing business has improved and household debt as a share of GDP is low compared with some of its Southeast Asian peers. Indonesian equities have lagged both EM broadly and EM Asia, and we believe there may be room for catch-up. Our stock picks here: banks, for their attractive valuations, as well as infrastructure such as tollroad operators and power companies
The Role Of Monetary Policy
Our Growth GPS points to the second EM support: synchronized global growth. The third leg of that support system is monetary policy. Many EM central banks are able to cut policy rates even as the Fed normalizes and other DMs weigh cutting back accommodation. We calculate seven major EM central banks, including Brazil’s and India’s, collectively delivered more than 1,000 basis points in rate cuts through
October of this year. Mexico was the only major EM central bank to increase rates in 2017. DMs are heading in the other direction. The key reason for the divergence: EM disinflation.
Case in point: Brazil’s inflation rate has tumbled from 10.7 percent at year-end 2015 to 2.5 percent today, according to Haver Analytics. And rate cuts have been dramatic, with the central bank’s Selic rate dropping over the past 12 months from 14.25 percent to 7.50 percent, its lowest since 2013. We see rates ending the year at 7 percent, with another 50 bps of easing in the first quarter of 2018. In India, central bank policy rates of 6 percent are their lowest since 2010, while Haver data show inflation has declined from 13.4 percent in January 2010 to 3.3 percent now. The upshot for equities: Reduced cost of funding supports the corporate sector and should stimulate spending and investing.
Have rate cuts hurt EM bank stocks? Financials make up nearly a quarter of the EM equity market and have lagged the highflying tech and consumer discretionary sectors this year. But we do not see rate cuts dragging the market down. EM rates have not hit zero and yield curves maintain a relatively normal slope. This has led to improving activity, which has eclipsed any impact of falling margins on bank earnings. Thomson Reuters data show Brazil’s financial sector is up over 30 percent in both U.S.- dollar and local-currency terms so far this year, outpacing the broader market by 8 percent. India financials tell a similar story, and we see their outlook as bright. A new $32 billion government package to recapitalize public banks should enhance lending capacity — especially to small to medium enterprises.
For The Love Of LatAm
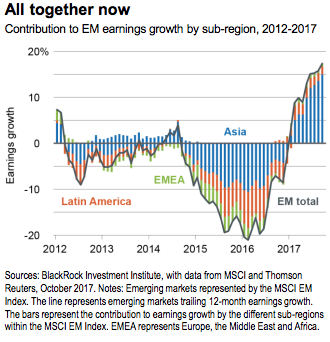
EM Asia has stolen the spotlight given impressive returns this year, but Latin America has been a bigger player in the EM profits recovery. LatAm has been contributing to earnings growth since mid-2016, with EM Asia catching up several months later, as shown in the All together now chart below. Today all three sub-regions within EM are contributing to earnings growth for the first time since 2012.
We see a favorable economic, political and fundamental environment for LatAm’s anchor market, Brazil. The largest companies by market cap were historically commodity producers, but today market leadership comes from banks and consumers, two areas we like. The country is less dependent on global trade than conventional wisdom suggests, a positive as trade pacts come into question. Nearly 80 percent of revenue comes from domestic sources, based on calculations using the MSCI Brazil Index.
We see Argentina as a small market with big potential. The MSCI Argentina Index, with a market capitalization of just $41 billion as of October, has soared 75 percent year-to-date in U.S.-dollar terms, according to Thomson Reuters data. The run-up comes as the country’s inclusion in the MSCI EM Index looms next year, and is further supported by favorable political and economic conditions, we believe. Economic growth is running at a 2.7 percent annual clip, according to the Argentine National Institute of Statistics and Censuses. Analysts estimate bank lending is improving at a 50 percent-60 percent year-on-year rate; inflation is falling; and entrepreneurialism is alive and well. The risks: Large fiscal and current account shortfalls make Argentina dependent on foreign capital and vulnerable to currency swings.
Mexican equities are more complicated. Domestic consumption is strong, but Mexico’s economic activity relies heavily on the U.S. NAFTA renegotiations and an upcoming 2018 presidential election have stoked uncertainty. This has kept fiscal and monetary policy tight, pending further clarity, and presents challenges for equities.
Raising Stakes, Recognizing Risks
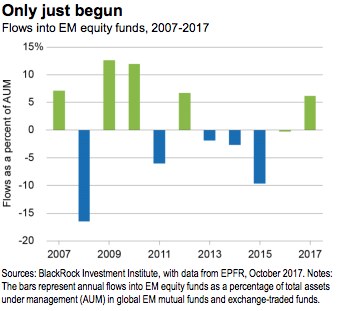
EMs are important to the global economy, representing a 35 percent share in current dollars and 60 percent based on purchasing power parity, according to IMF estimates. Their presence in global equity indexes is far smaller, at 12 percent of the MSCI All-Country World Index currently. And many investor portfolios fall well below that: BlackRock analysis of U.S. advisor allocations shows total portfolio exposure to EM equities at just 3.5 percent as of September. But investors seem to be warming up. Net flows into EM equity funds are on track to reach $70 billion this year, or about 6 percent of assets under management (AUM), as illustrated In the Only just begun chart above. This is a solid reversal from the $114 billion in outflows over the last four years (amounting to 14 percent of AUM). And yet fund flows and price momentum are not signaling mania, research from BlackRock’s Risk and Quantitative Analysis team shows.
EM equity and debt flows have benefited from easy monetary policy in what has been a prolonged investor search for yield. Nearly 50 percent of EM portfolio inflows are a result of Fed actions and quantitative easing (QE), based on IMF estimates. QE has depressed DM yields, making relatively high EM yields an attractive proposition. Equally noteworthy are flows within EM. Equity flows from mainland China to Hong Kong now account for 10 percent of daily exchange volume and roughly 50 percent of global EM net inflows year-to-date, based on data from Wind Info.
What are the risks? The Fed's move to stop reinvesting maturing bond holdings reduces global QE. The IMF estimates 30 percent of the flows into EM since 2010 due explicitly to U.S. monetary policy could reverse over the next 24 months. That may not fully capture the effect of improved global growth, however. A rapidly strengthening U.S. dollar would be a related risk, as it has often proved in the past. We only see the dollar appreciating gradually, however, and expect limited impact on most EMs. The majority have stronger current accounts and reserves than during 2013's "taper tantrum." Other risks? A stronger-than-expected slowdown in China, potential for tense trade relations, and elections and populist politics undermining reform agendas. All of these risks are real but do not overpower what we see as a solid investment case for EM equities.
Kate Moore is chief equity strategist for BlackRock.