


After lagging value stocks by 0.31% in June when the U.S. Treasury Yield Curve (as measured by the difference between 2-Year and 10-Year yields) steepened from 0.20% to 0.25%, and as investors continued to price in the impact of a lower Federal funds rate at the July FOMC meeting, growth stocks have roared back in July with a 1.71% relative return, even as the curve has continued to steepen modestly.
While the road for equities may be bumpy throughout earnings season, especially considering how investors punished companies missing consensus estimates in the first quarter, we believe that growth stocks remain in the driver’s seat for the remainder of 2019 thanks to what will likely be a limited steepening of the yield curve, as the market has priced in cuts in July and September.
What We’ve Seen
• Over the last twelve months, growth has beaten value by 2.51%, with much of the spread driven by performance and weight differences at the sector level as technology companies in the growth index returned 17.62%, while those in value returned 15.53%. Value’s heavyweight—financials—was up only 2.90% in value, but 12.48% in growth. In addition, growth’s underweight to energy helped as the sector was down 14.74% on average over the last year.
• More impressive than the one-year return is growth’s 25.20% year-to-date performance, beating value by a whopping 7.40%. July’s 1.71% relative return for growth over value is better than April’s 0.97% and if it continues is on pace to beat March’s 2.21% spread.
TECHNOLOGY BEATING FINANCIALS HAS LIFTED GROWTH RELATIVE TO VALUE
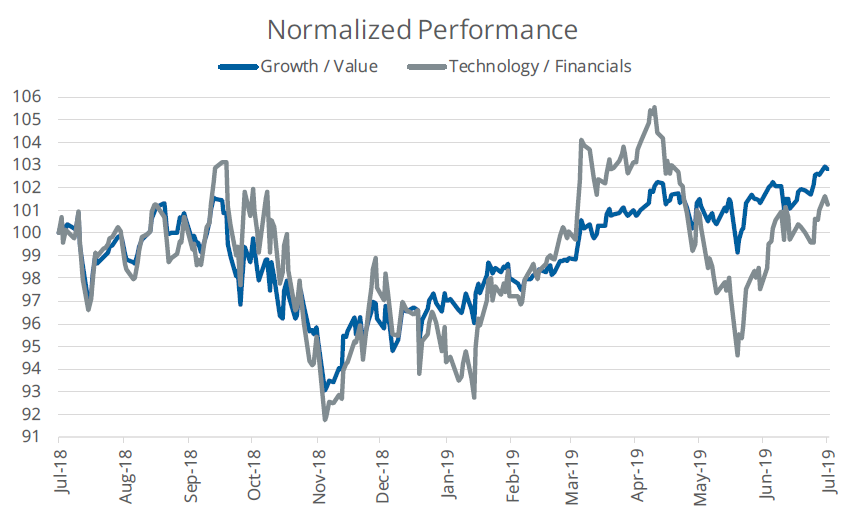
Source: FTSE Russell, as of July 16, 2019. Growth represented by the Russell 1000 Growth Index, value represented by the Russell 1000 Value Index, Technology represented by the Russell 1000 Technology Index and Financials represented by the Russell 1000 Financial Services Index. One cannot invest directly in an index.
Money in Motion
Recent ETF activity highlights how much investors have abandoned value in favor of growth.
• Growth ETFs have taken in $2.14 billion more than value ETFs over the last three months and $5.36 billion more over the last six months. Over the past month, we have seen some recovery in relative flows, but growth continues to be in the lead relative to value by $639 million.
• These flows are even more remarkable when considering where they came from. In December 2018, value ETFs had seen over $12 billion greater flows than growth ETFs over a rolling six-month period and have steadily seen that move in growth’s favor—first turning positive in early May before roaring ahead since then.
GROWTH ETFS CONTINUE TO RAKE IN MONEY
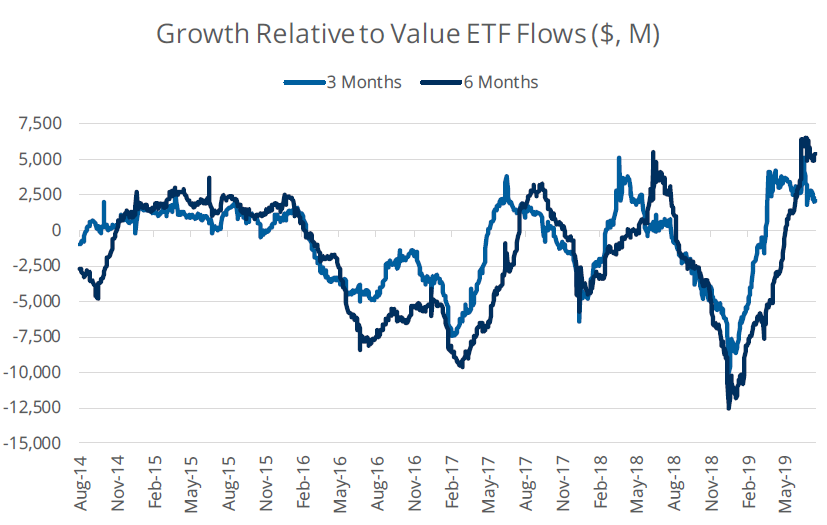
Source: Bloomberg Finance, L.P., as of July 16, 2019. Data represents the rolling three- and six-month net flows of U.S.-listed U.S. Large Cap Growth ETFs and U.S. Large Cap Value ETFs, specifically targeting exposure to U.S. Large Cap Growth and Value stocks, respectively. For example, when the lines are positive, U.S. Large Cap Growth gathered greater flows than Value. On the other hand, when the lines are negative, U.S. Large Cap Growth gathered less flows than Value.
What’s Next?
While the macroeconomic environment has been tilted toward growth, an under-appreciated driver of growth’s outperformance has been investors’ preference for companies with superior operating margins as they have favored higher-quality firms.
• What is notable is that margins for growth companies are higher historically than those of value firms, but the difference between the two remain wider than their historical averages and are greater than their averages since 2010 after value firms recovered from the compressed margins they experienced in the global financial crisis.
• This quarter’s earnings season also points to growth being in a better position than value as growth is expected to see 7.90% growth compared to value’s EPS being down 1.28%. Looking ahead to the third quarter, earnings-per-share for growth are anticipated to increase 3.32% with value’s declining 2.73%.
• Growth stocks are not without their risks, however, as a failure to meet top-line or bottom-line growth expectations could drive multiples lower for these names. That said, this is not our base case and we believe that the market will reward those names showing above-average growth potential, especially as higher growth becomes scarcer.
VALUE’S OPERATING MARGINS CONTINUE TO LAG
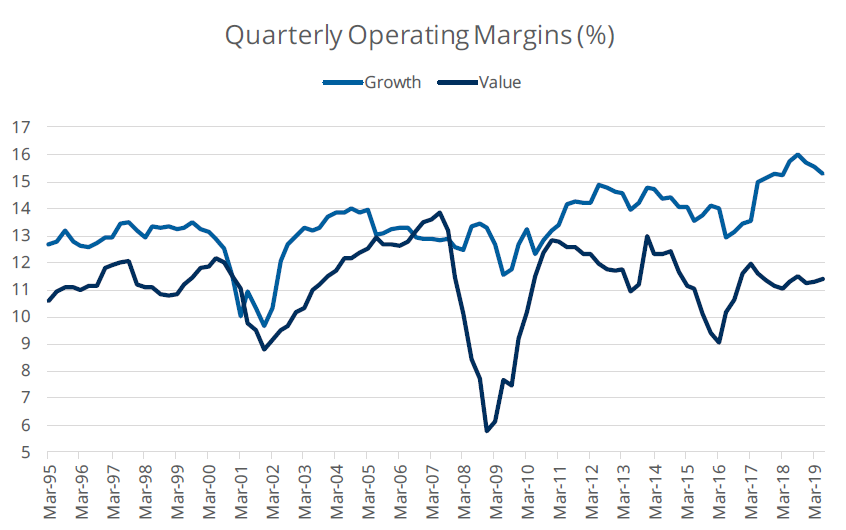
Source: Bloomberg Finance, L.P., as of July 16, 2019. Growth represented by the Russell 1000 Growth Index and value represented by the Russell 1000 Value Index. One cannot invest directly in an index.
— David Mazza is managing director and head of product at ETF provider Direxion.