


As an avid baseball fan, one part of fall I enjoy as much as the colorful leaves and crisp air is the postseason. I was excited to see both the Tampa Bay Rays and Los Angeles Dodgers in the playoffs again after facing each other in the World Series last year. I should note this fact did little to heal the familiar heartbreak the Cubs have provided to devoted fans like me this season.
While both the Rays and the Dodgers are great teams, what makes Tampa’s continuing success especially impressive is their meager payroll—around $70 million in 2021 compared to the Dodgers $267 million, which is the highest in baseball[1]. The discrepancy was similar last year, when the Dodgers’ payroll was about four times as much as the Rays[2].
Financial professionals can learn a lot from the Rays’ approach to building strong teams—even if they’re not baseball fans and despite the team’s heartbreaking loss to the Red Sox recently to end their postseason. In fact, by applying a similar strategy to their practices, they can support better retirement outcomes for their clients and offer greater clarity and confidence. If you’re skeptical, please join me in a little baseball talk.
Moneyball Redefines The Art Of Winning
First, let’s briefly examine the Rays’ philosophy to roster-building. They are credited with improving on the “Moneyball” methodology pioneered by Oakland Athletics manager Billy Beane in the early 2000s[3]. The term became popular after author Michael Lewis published Moneyball: The Art of Winning an Unfair Game in 2003[4], which was later adapted into a popular movie starring Brad Pitt as Beane[5].
Faced with a tight budget, Beane and his staff shunned conventional baseball wisdom to compete with richer clubs. They theorized that traditional measures of a player’s worth like batting average or the “pop” of the ball off his bat didn’t represent his true contribution to winning. Using quantifiable traits that could be measured statistically, they found that certain attributes most teams barely considered were highly correlated with winning games[6].
For instance, they determined a player’s on-base percentage is one of the most important contributors to the success of a ball club[7]. Whether a player reached base from a hit or walk didn’t matter, so the more traditional batting average metric was far less important than many realized. By favoring slugging percentage—a measure of a hitter’s batting productivity—and other statistics that more reliably predict wins, they gained an edge over the big-market ball clubs with their roster of undervalued players that could compete against any team[8]. The Rays have been winning consistently by playing Moneyball some 20 years later.
Retirement Planning: Telling The Whole Story
The way Beane defined winning attributes in baseball also can be applied to successful financial planning. We often do a good job on the financial part without considering what a winning financial plan really looks like through the eyes of clients. In the process, we can focus too much on success as measured by financial planning software—think batting average—that doesn’t really tell the whole story.
Most financial planning software relies on probabilities from random Monte Carlo trials. It can advise you how often a client is likely to run out of money before the end of their plan or the likelihood they will meet their financial goals[9]. If a client can meet these goals in 850 out of 1,000 randomized trails, then the plan would have an 85% probability of success.
There is certainly nothing wrong with an 85% success rate and no doubt that Monte Carlo is a great way to determine how a specific recommendation might affect the plan or whether it’s significantly better or worse than another. However, if all you’re considering is this probability, you and your client aren’t getting the whole story.
For example, imagine retirement plans A and B both have an 85% probability of success but in Plan A, only 20% of the projected expenses are covered by guaranteed income. We know most retirees spend the money that comes in as regular income flow and try to preserve their assets, instead of spending down their savings[10]. For this reason, if Plan B includes a guaranteed income product such as an annuity to cover a higher portion of expenses than Plan A, most clients would likely consider it a more favorable plan.
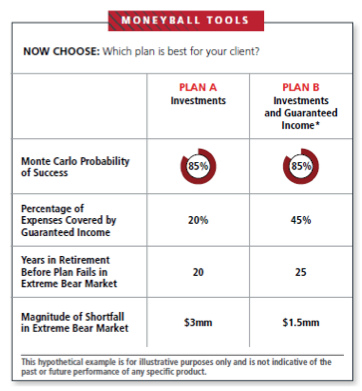
In other words, just as two players with similar batting averages can have very different impacts on a team, two plans with identical probabilities of success can deliver vastly different client experiences. We can also consider how the plan fares in an extreme bear market trial — whether it fails at 20 or 25 years into the plan—or the magnitude of the shortfall, whether it involves going broke by a dollar or $10 million[11]. A Monte Carlo’s probability doesn’t provide this information, although from a client’s lens, these are important variables.